-
Experiments page
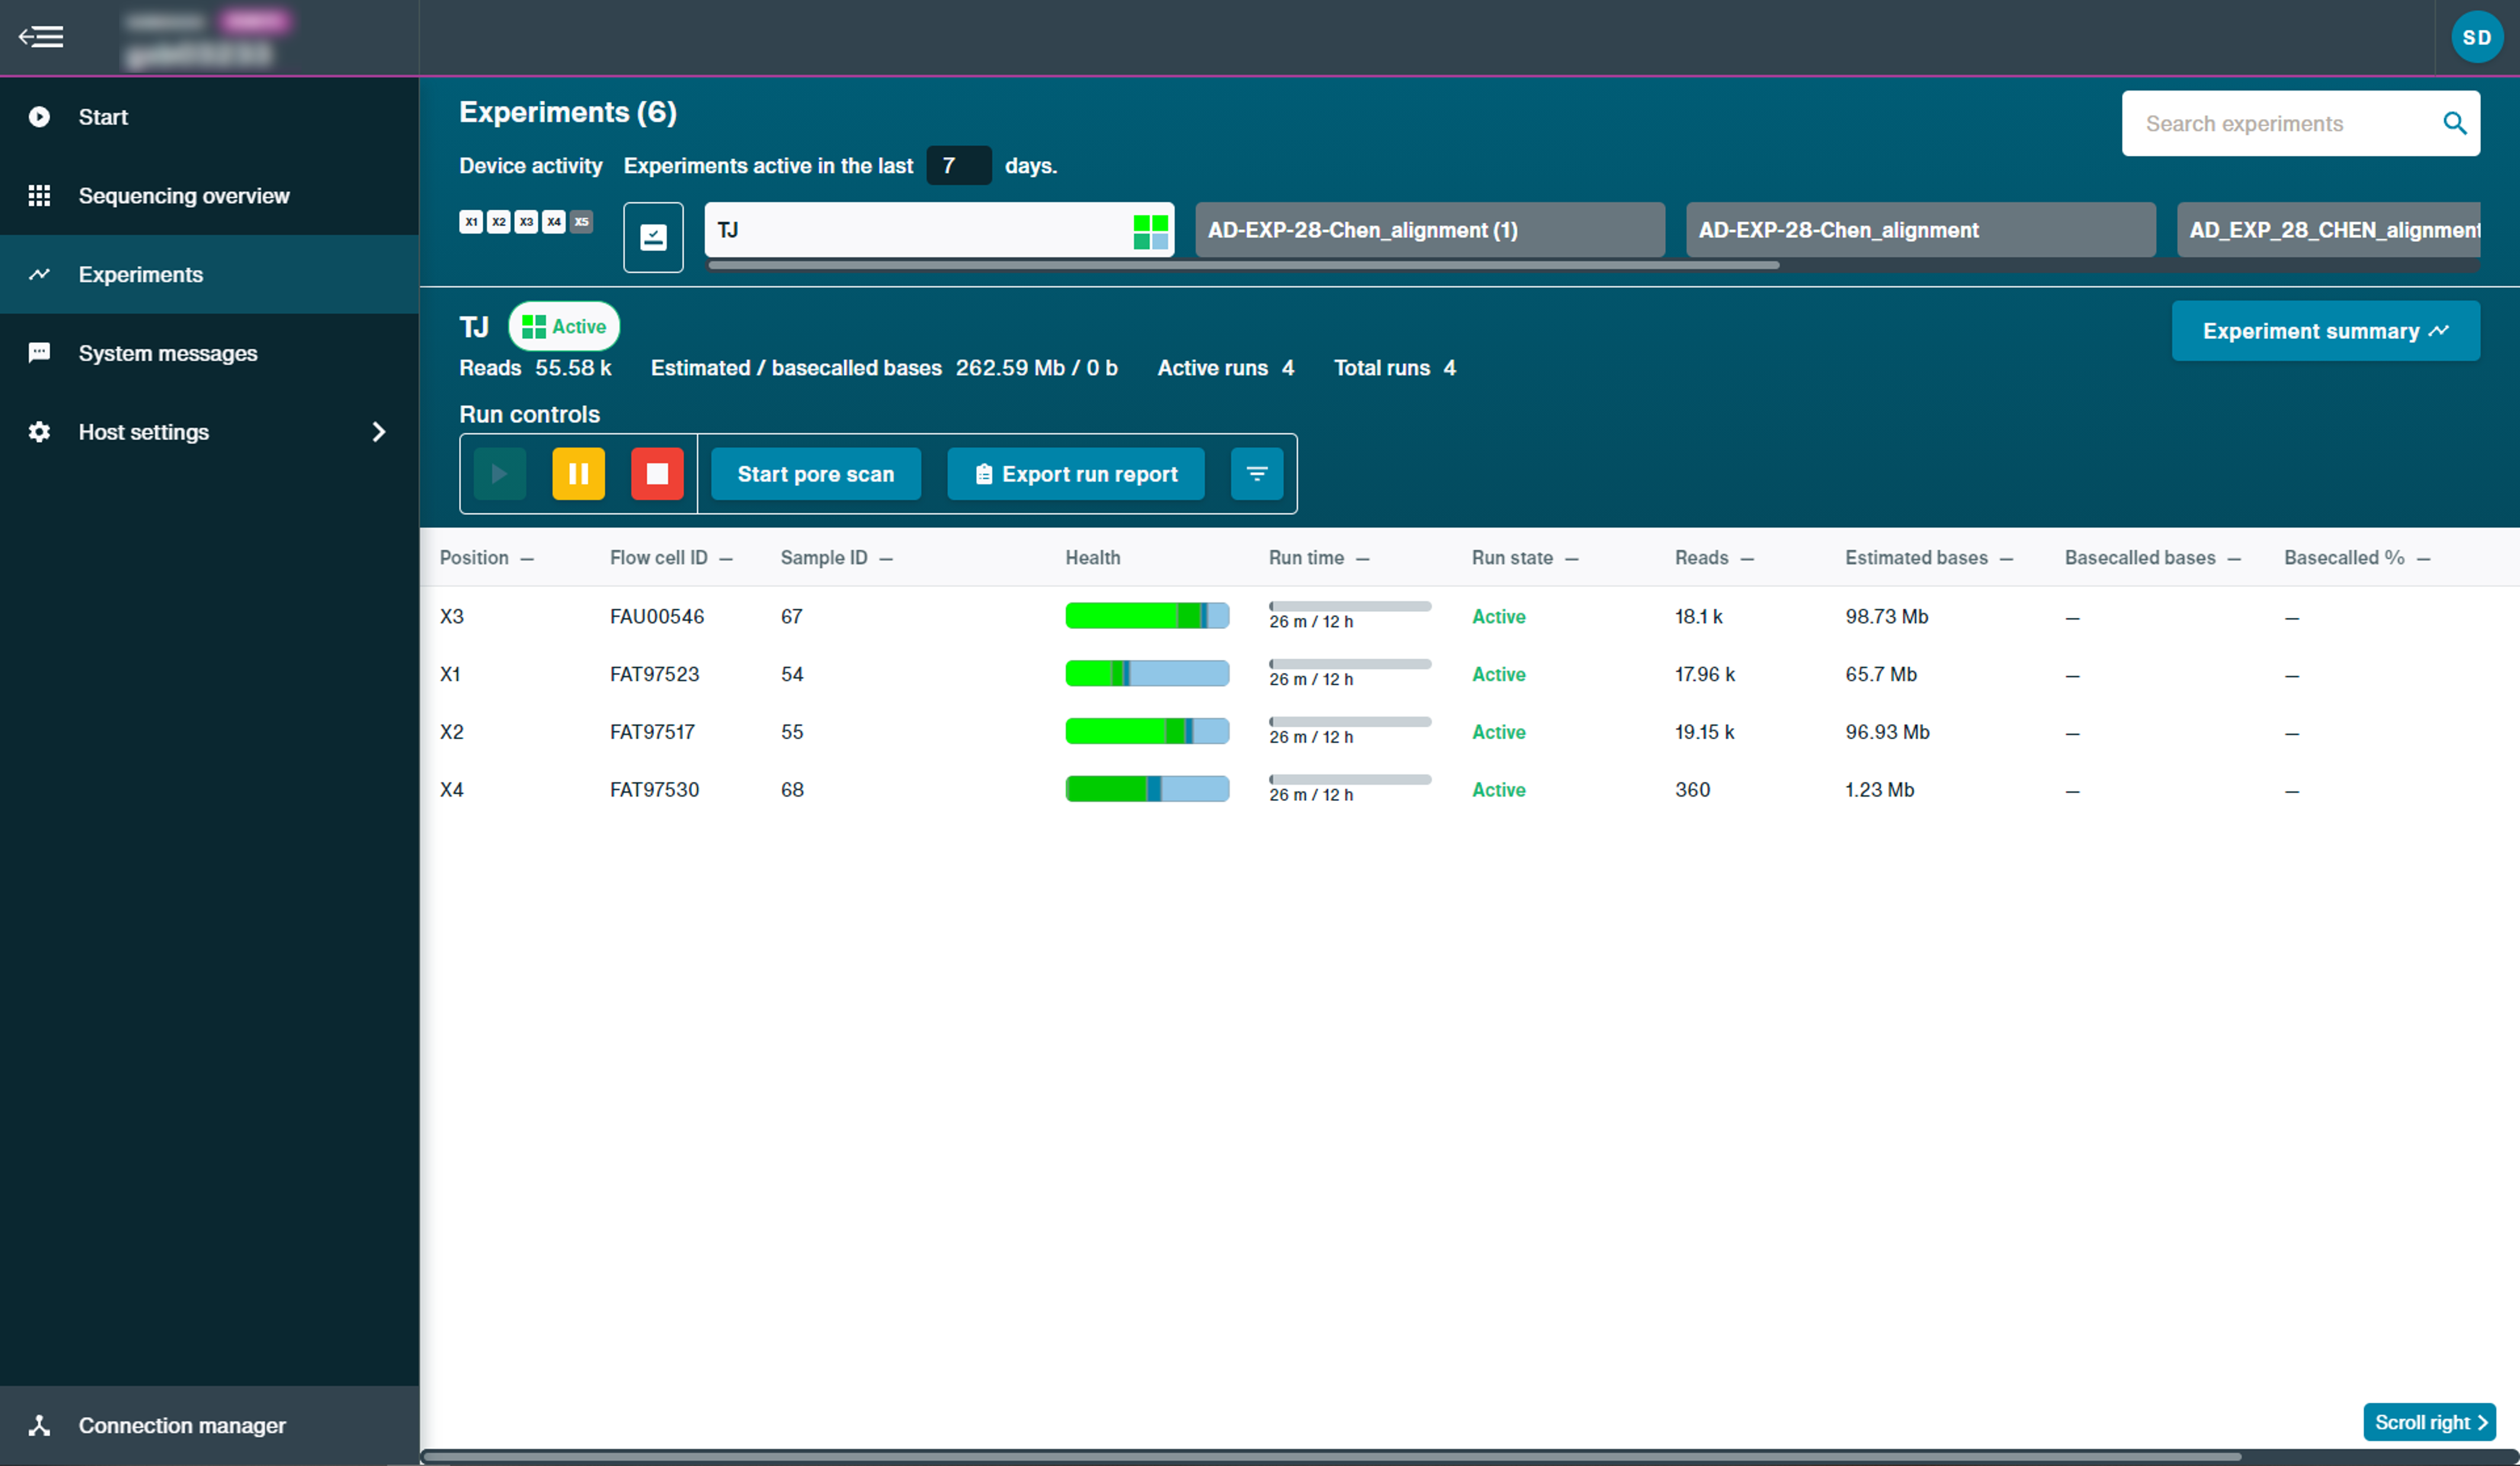
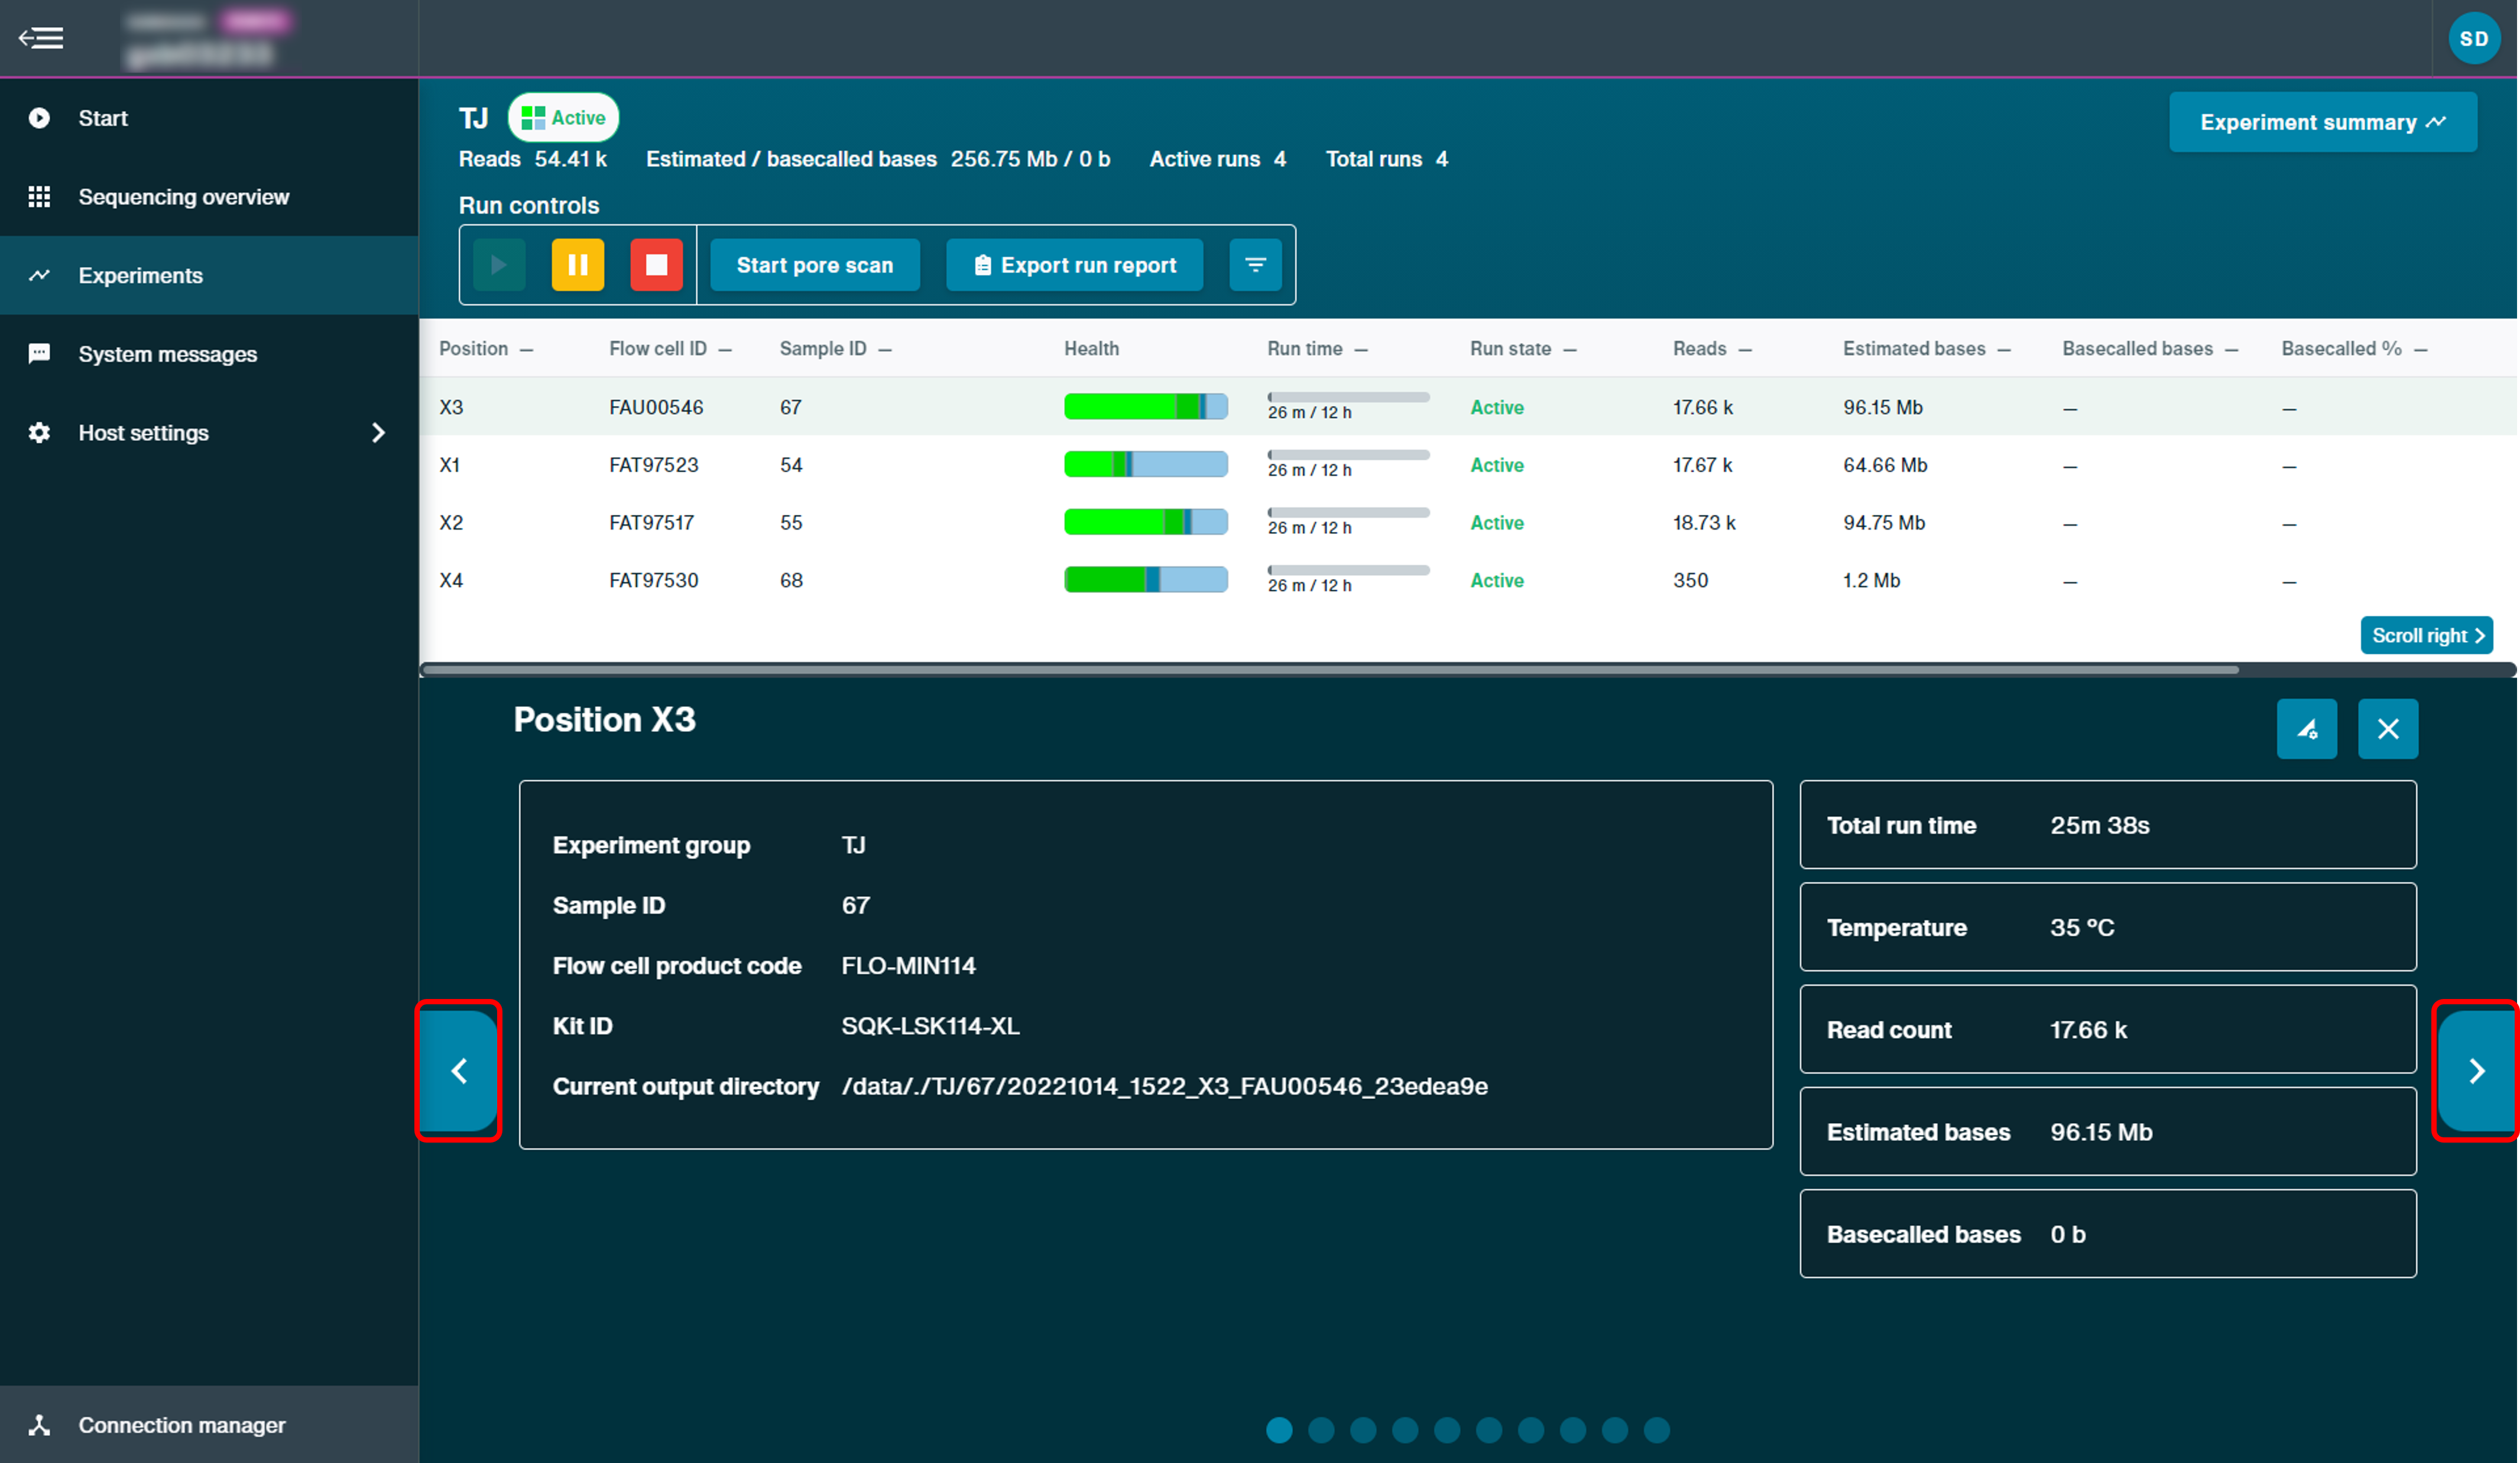
The experiments page displays summary information for all sequencing flow cells and device checks carried out on the device.
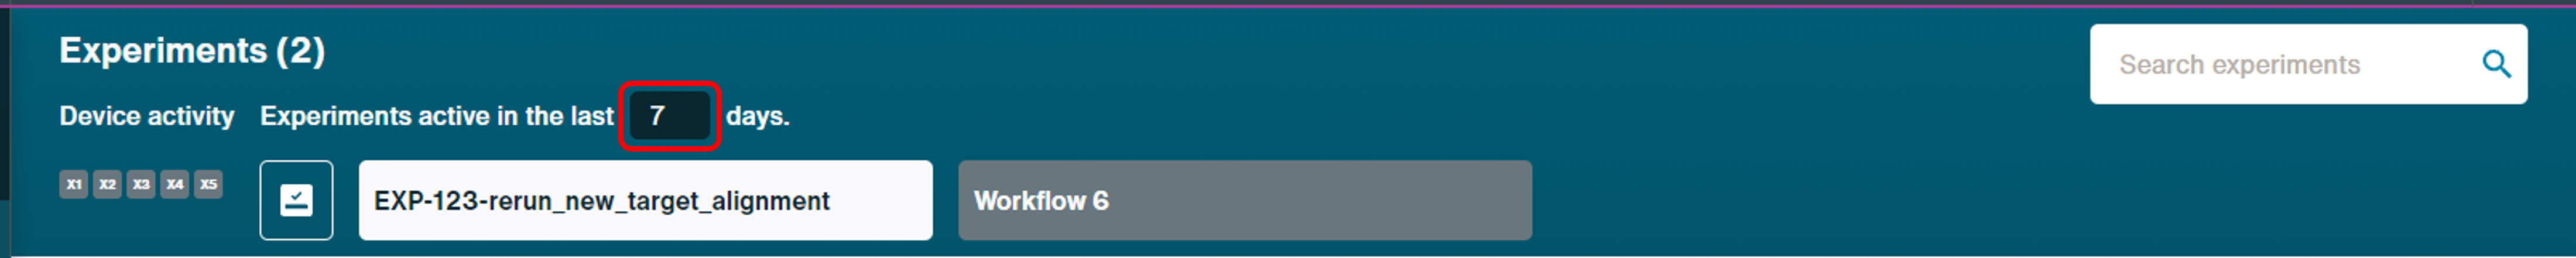
Previous runs can be viewed on the UI at the top of the screen and the number of days to view the last active experiments can be altered by typing in a different integer.
From this page, you can control specific runs and identify real-time information, including flow cell health and reads.
- Run statistics: The total number of reads, estimated and basecalled bases across an experiment, and number of active and total runs
- Run time: The duration of the experiment
- Run state: The current state of the sequencing run; 'Active', 'Basecalling', 'Complete', 'Stopped with error'
- Health: The current flow cell health
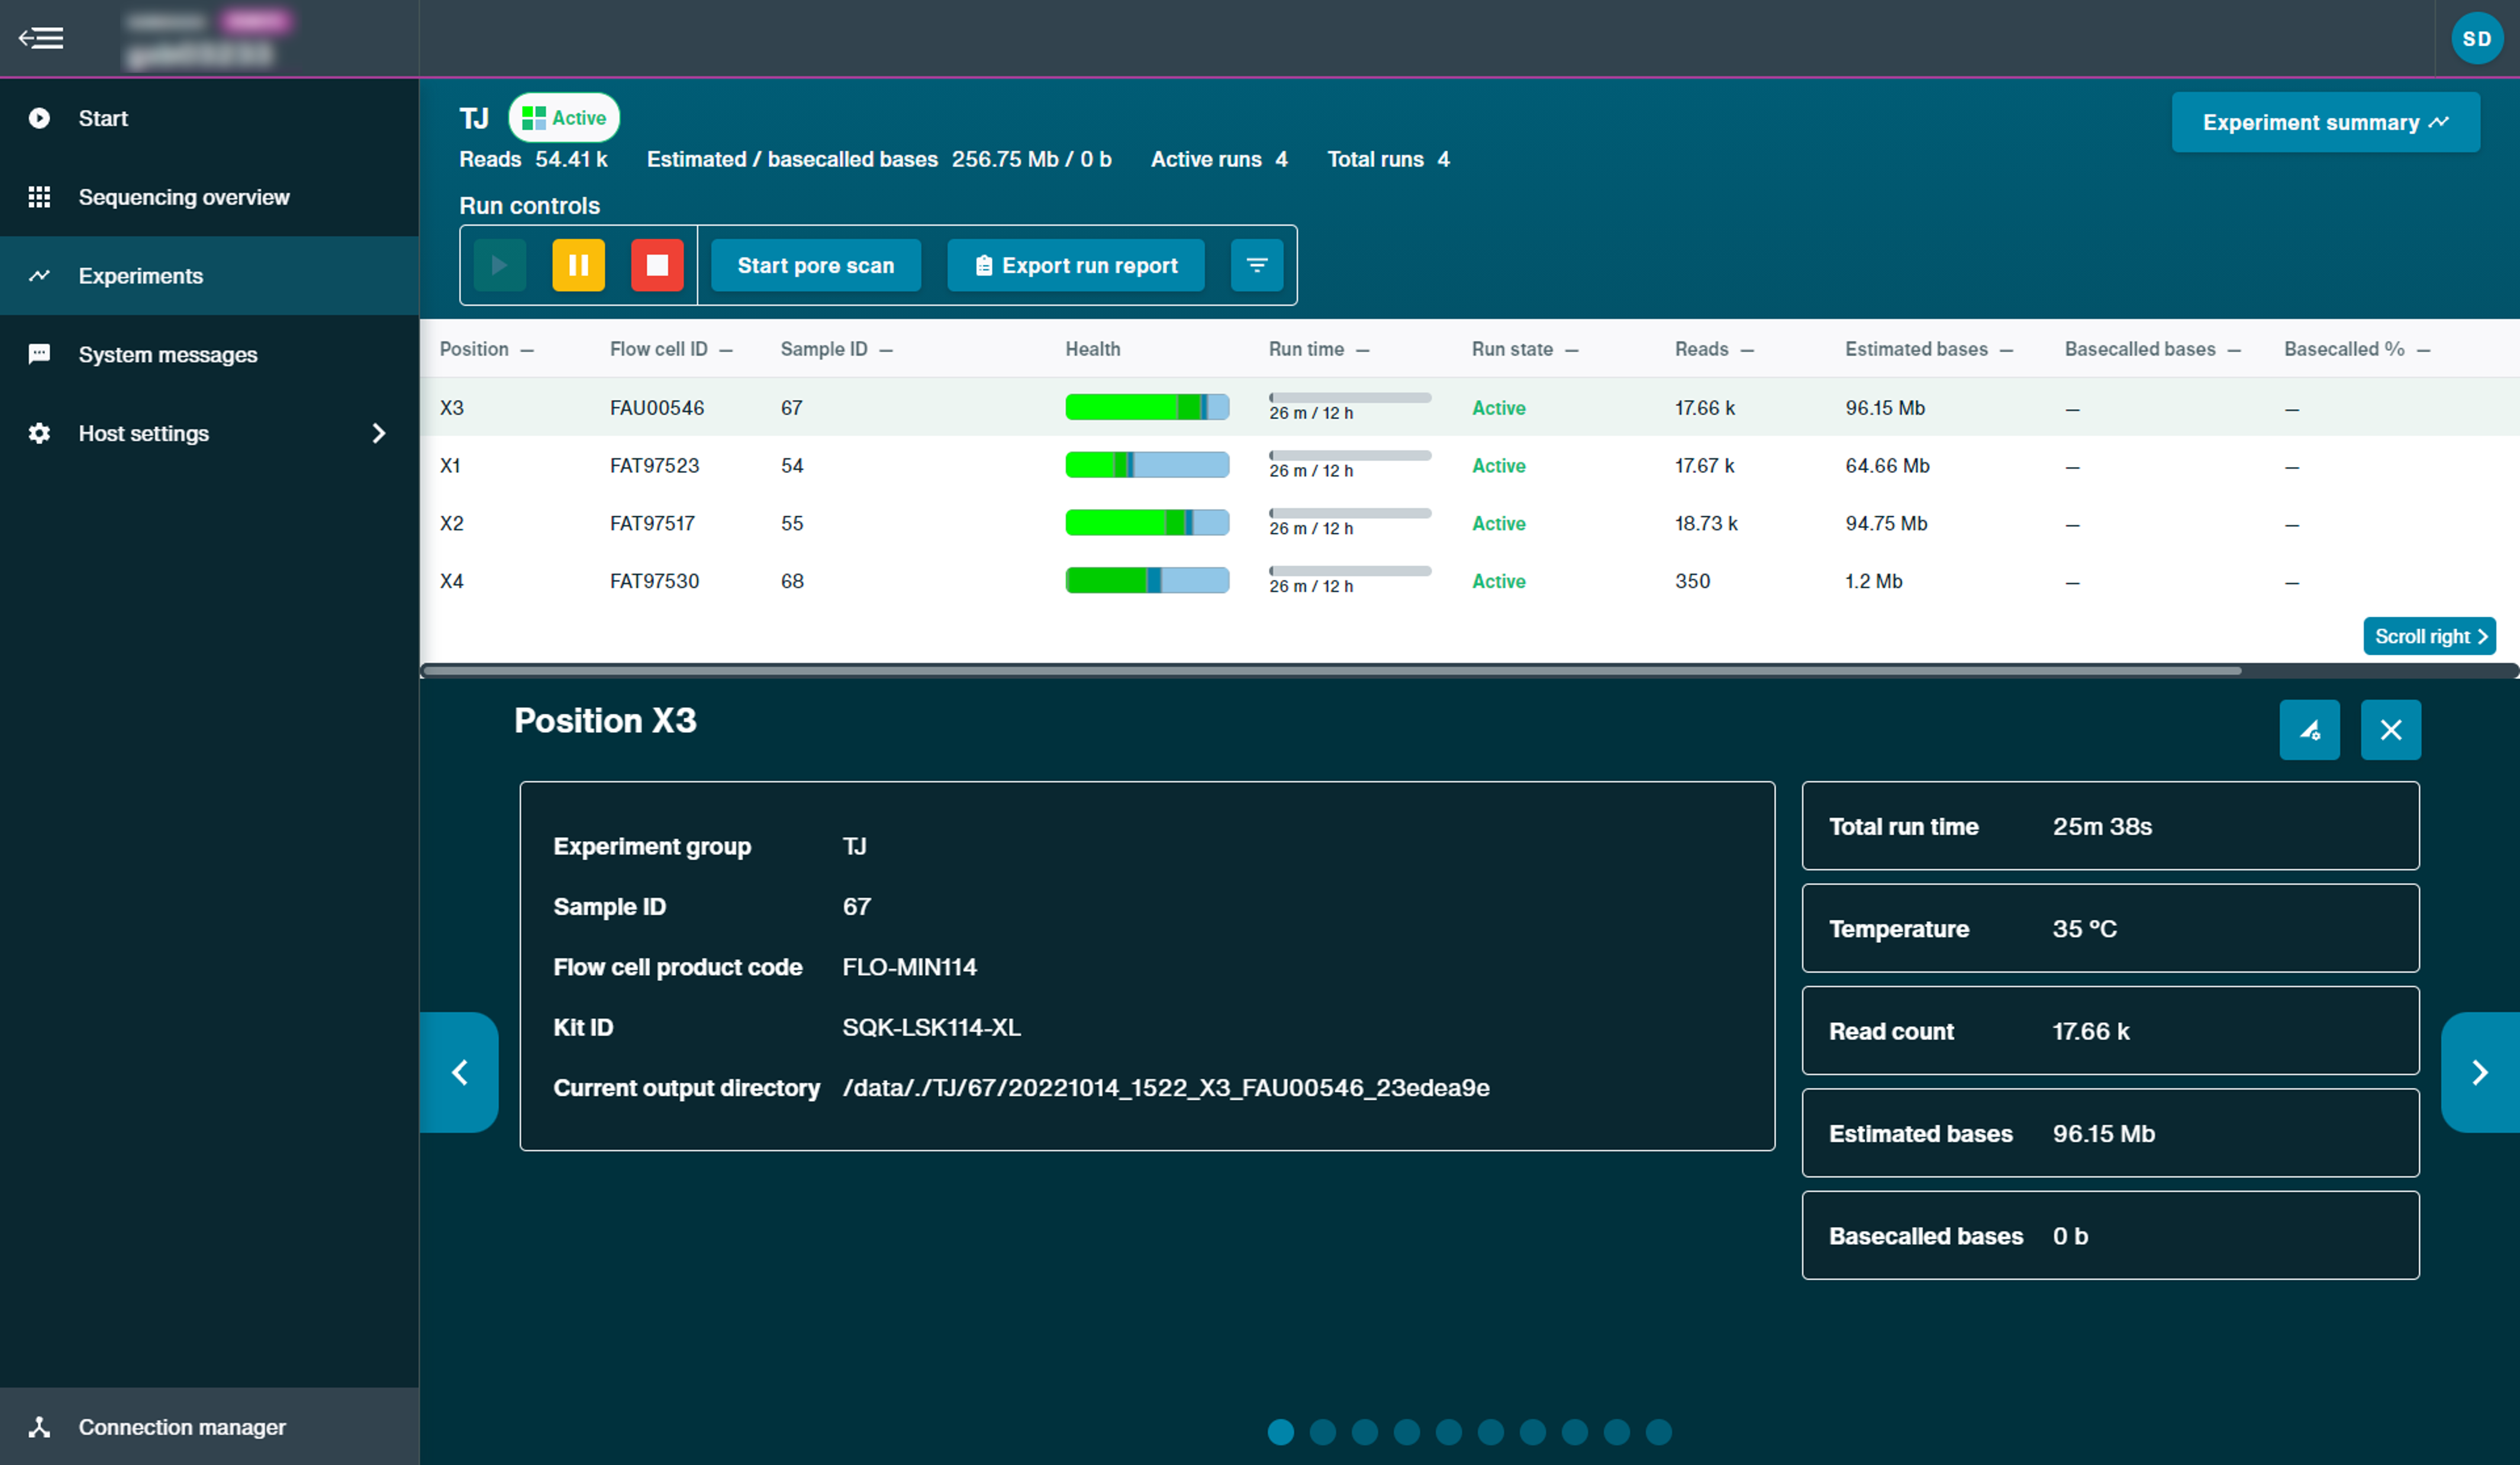
The white panel displays a summary of sequencing experiments and the blue panel displays status information of a specific run.
Example of experiments page on GridION:
For more status information of a specific run, click the run to open the quick view, including current temperature and voltage. In the example below, the run in position X3 was clicked to open the quick view.
-
Live sequencing graph configuration
Page configuration allows you to choose which graphs to generate in the quick view of an experiment.
To open page configuration, click on a run in the white panel to open the quick view and select the highlighted button to choose which graphs to display.
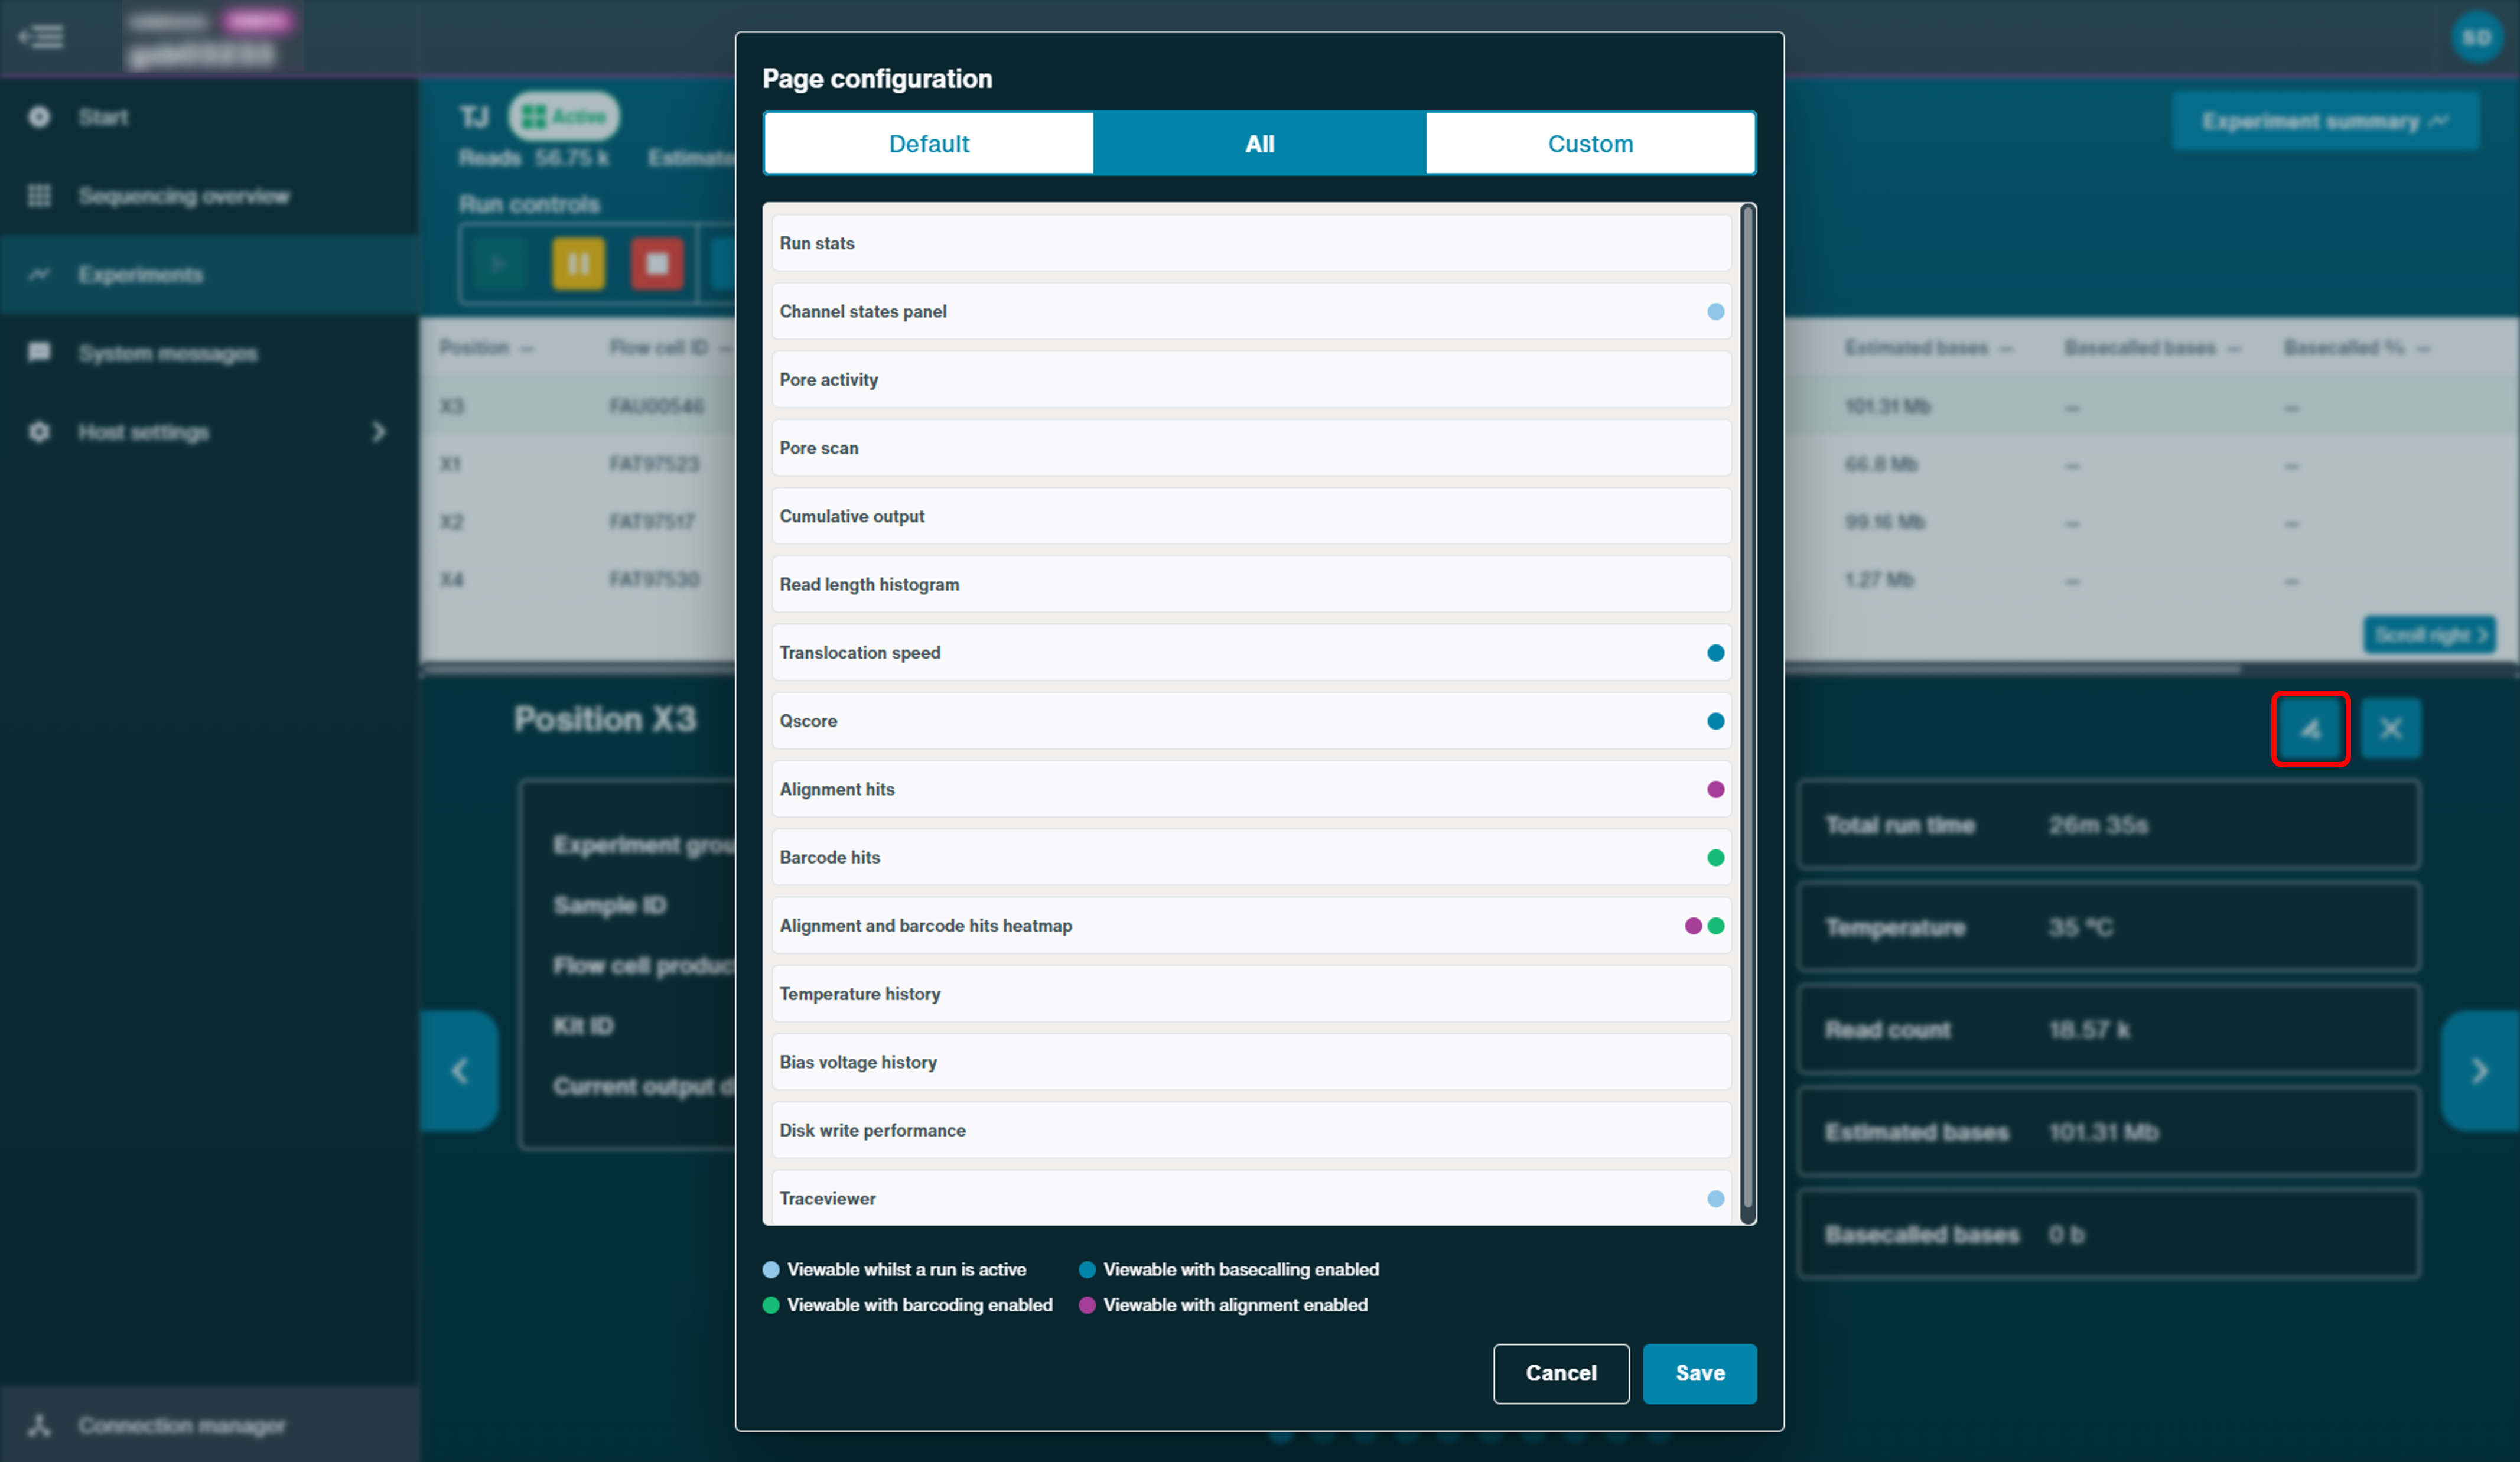
Tabs:
- Default: Default graphs available
- All: All graphs available
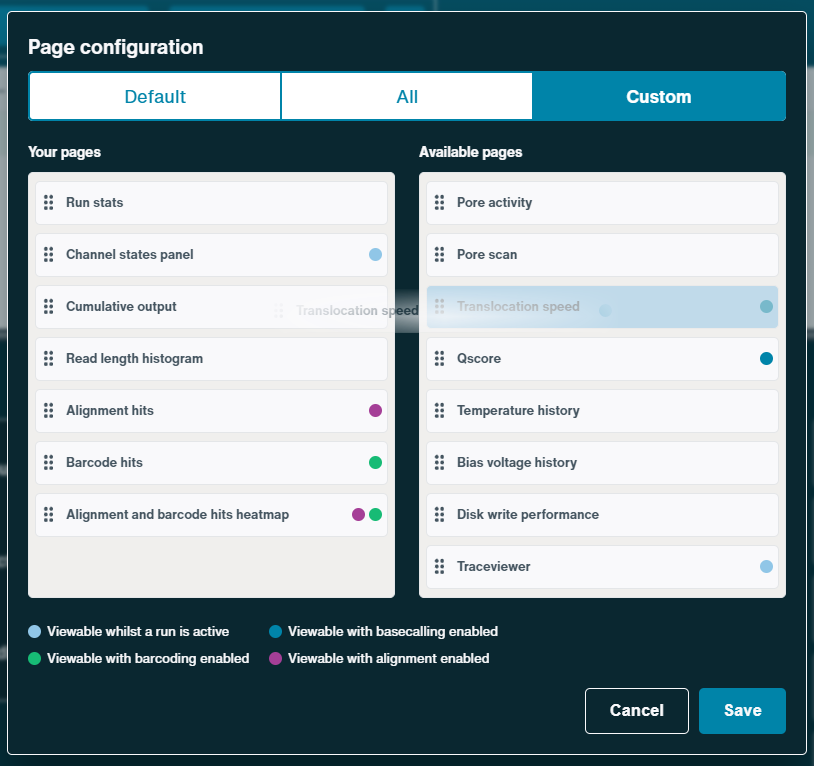
- Custom: Users can move graphs from 'Available pages' to 'Your pages' to display a custom order of graphs in the GUI. On this page, you can also choose graph order. Click the graph and drag, then click Save.
-
Graphs
Click on the specific run to open the experiment details and view the graphs. Use the arrows to navigate between the graphs.
For more information about the graphs, refer to Check and monitoring in the 'Monitoring and troubleshooting your sequencing run' section.
-
Pausing
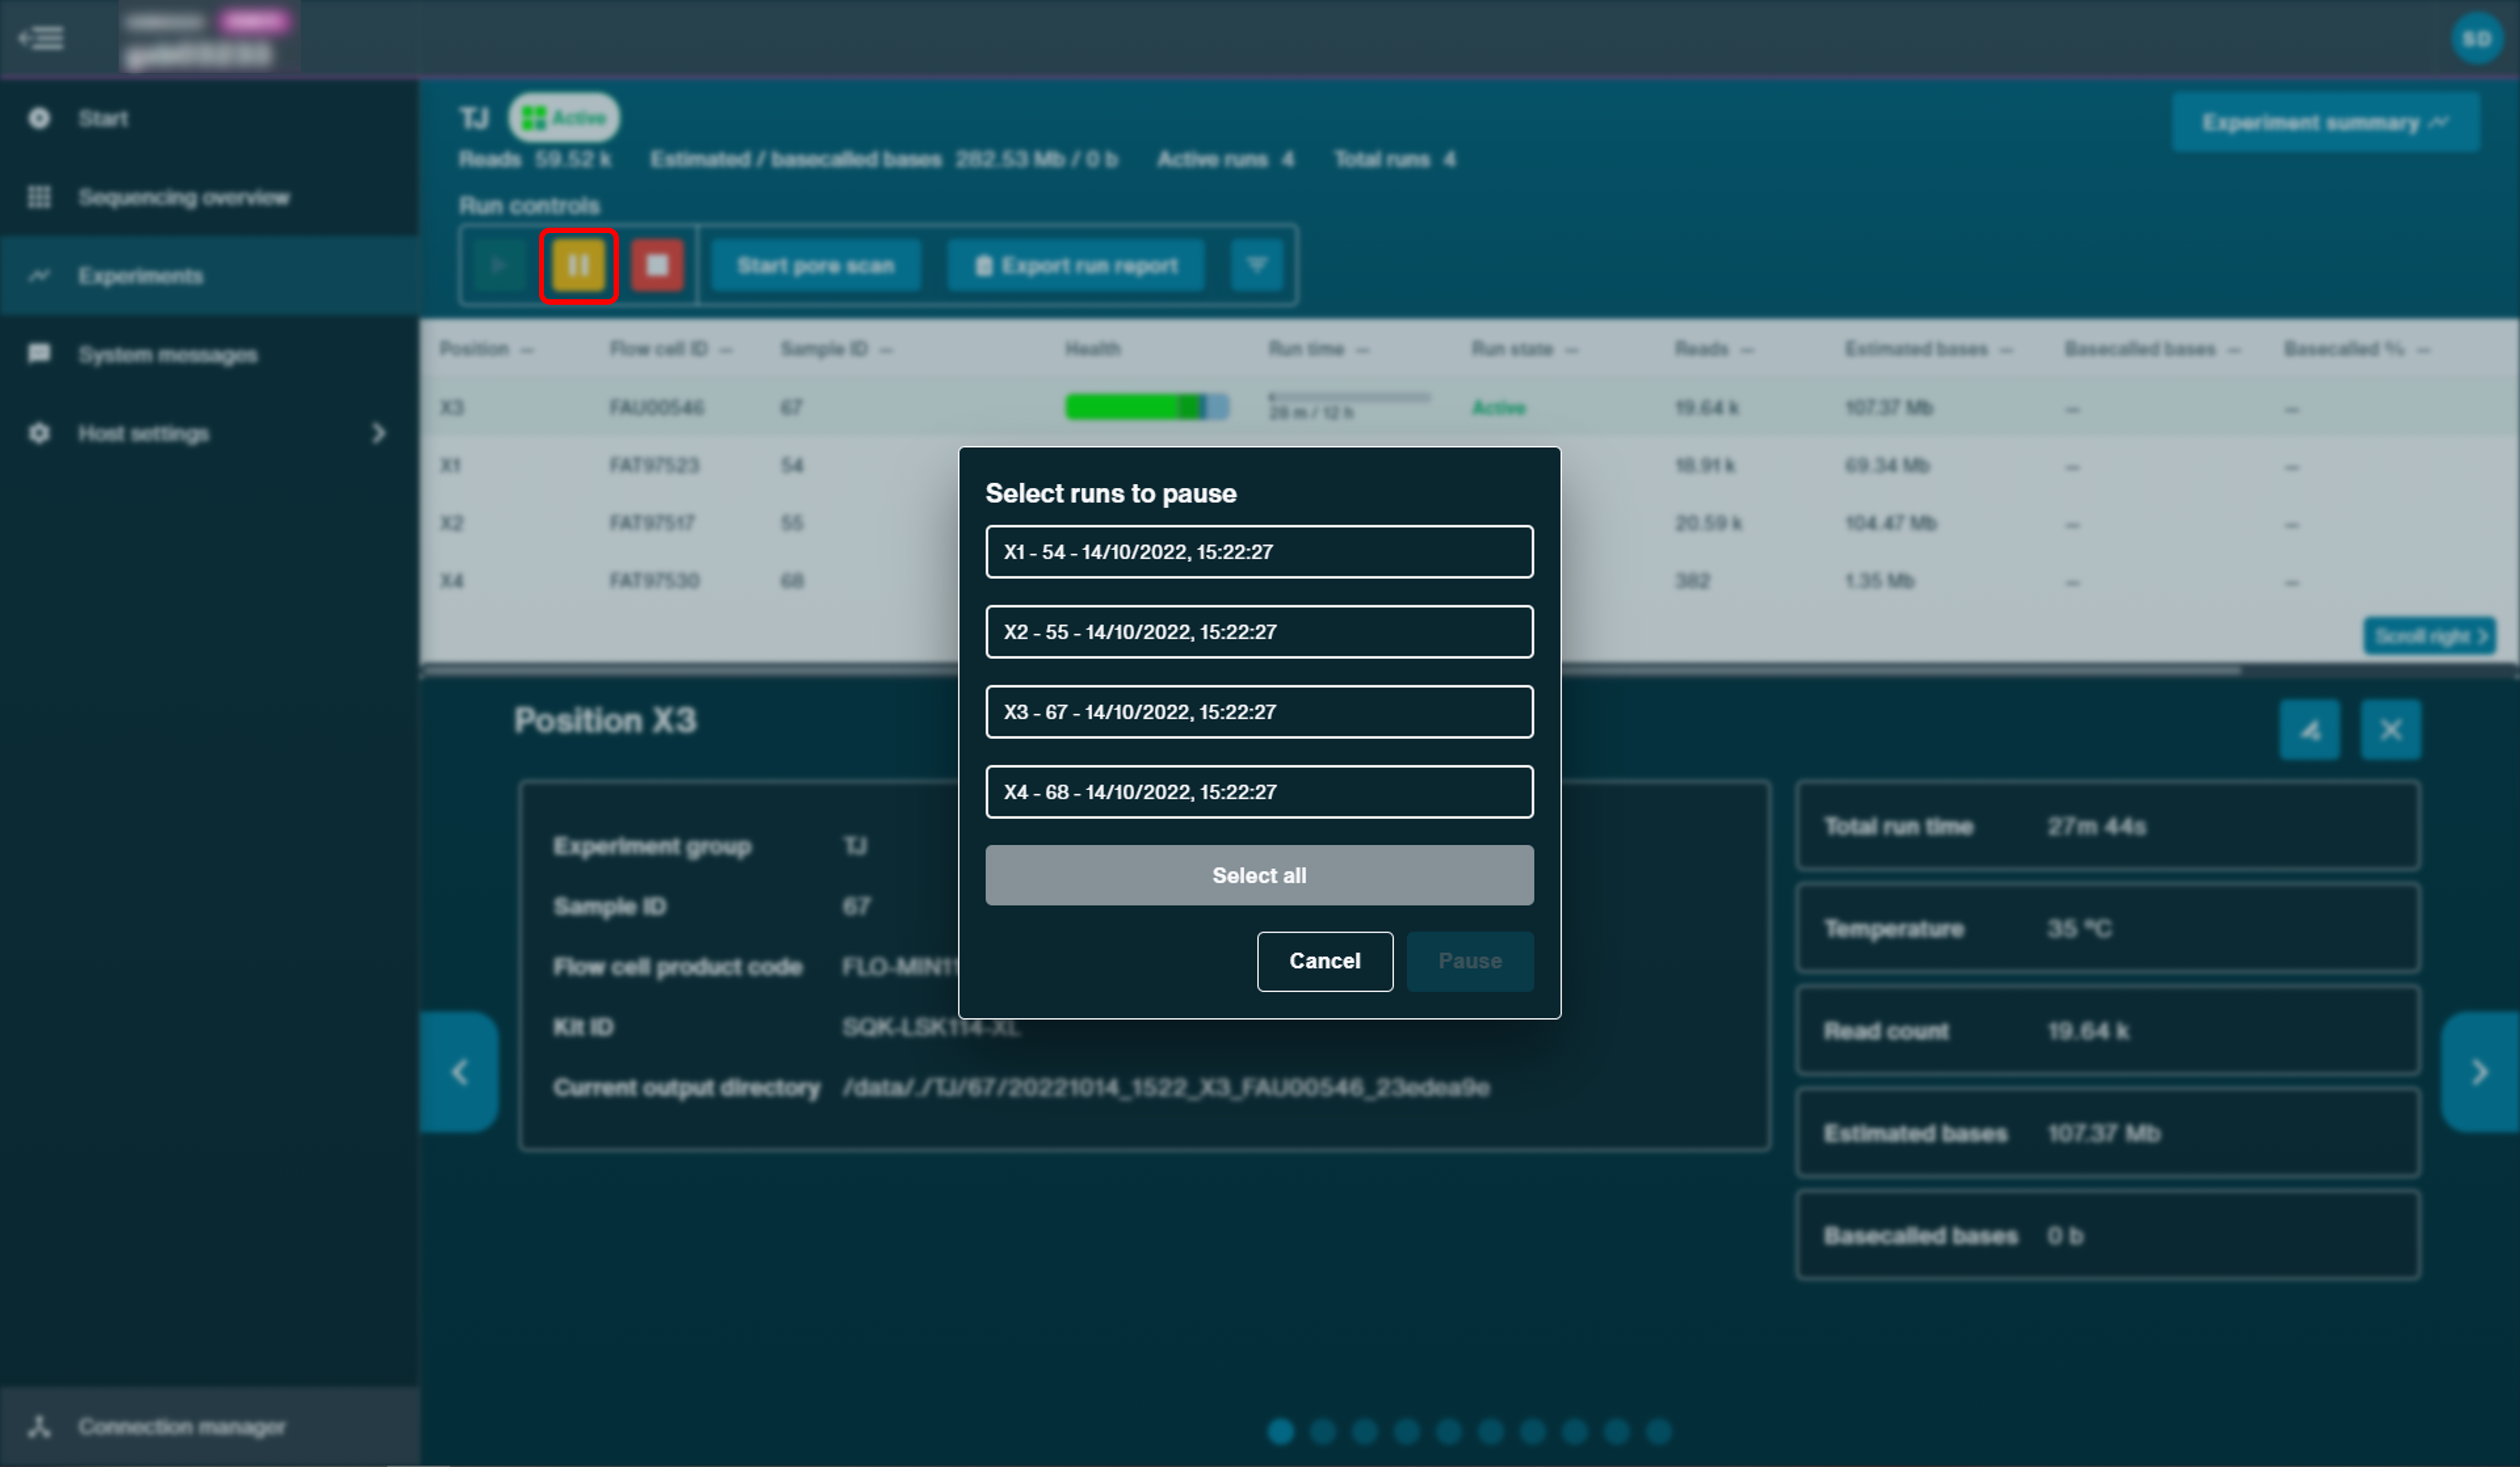
Sequencing experiments can be paused by selecting and pausing a single or all flow cell positions.
Pausing works by dropping the voltage potential over the membrane to 0 mV to maintain a safe environment to add components, such as more DNA/RNA library or nucleases for a flow cell wash. Data acquisition will continue during this period, as this prevents sequencing data from being lost.
To pause, click Pause in the run controls to open a dialogue box and select which flow cell position(s) to pause and click Pause.
-
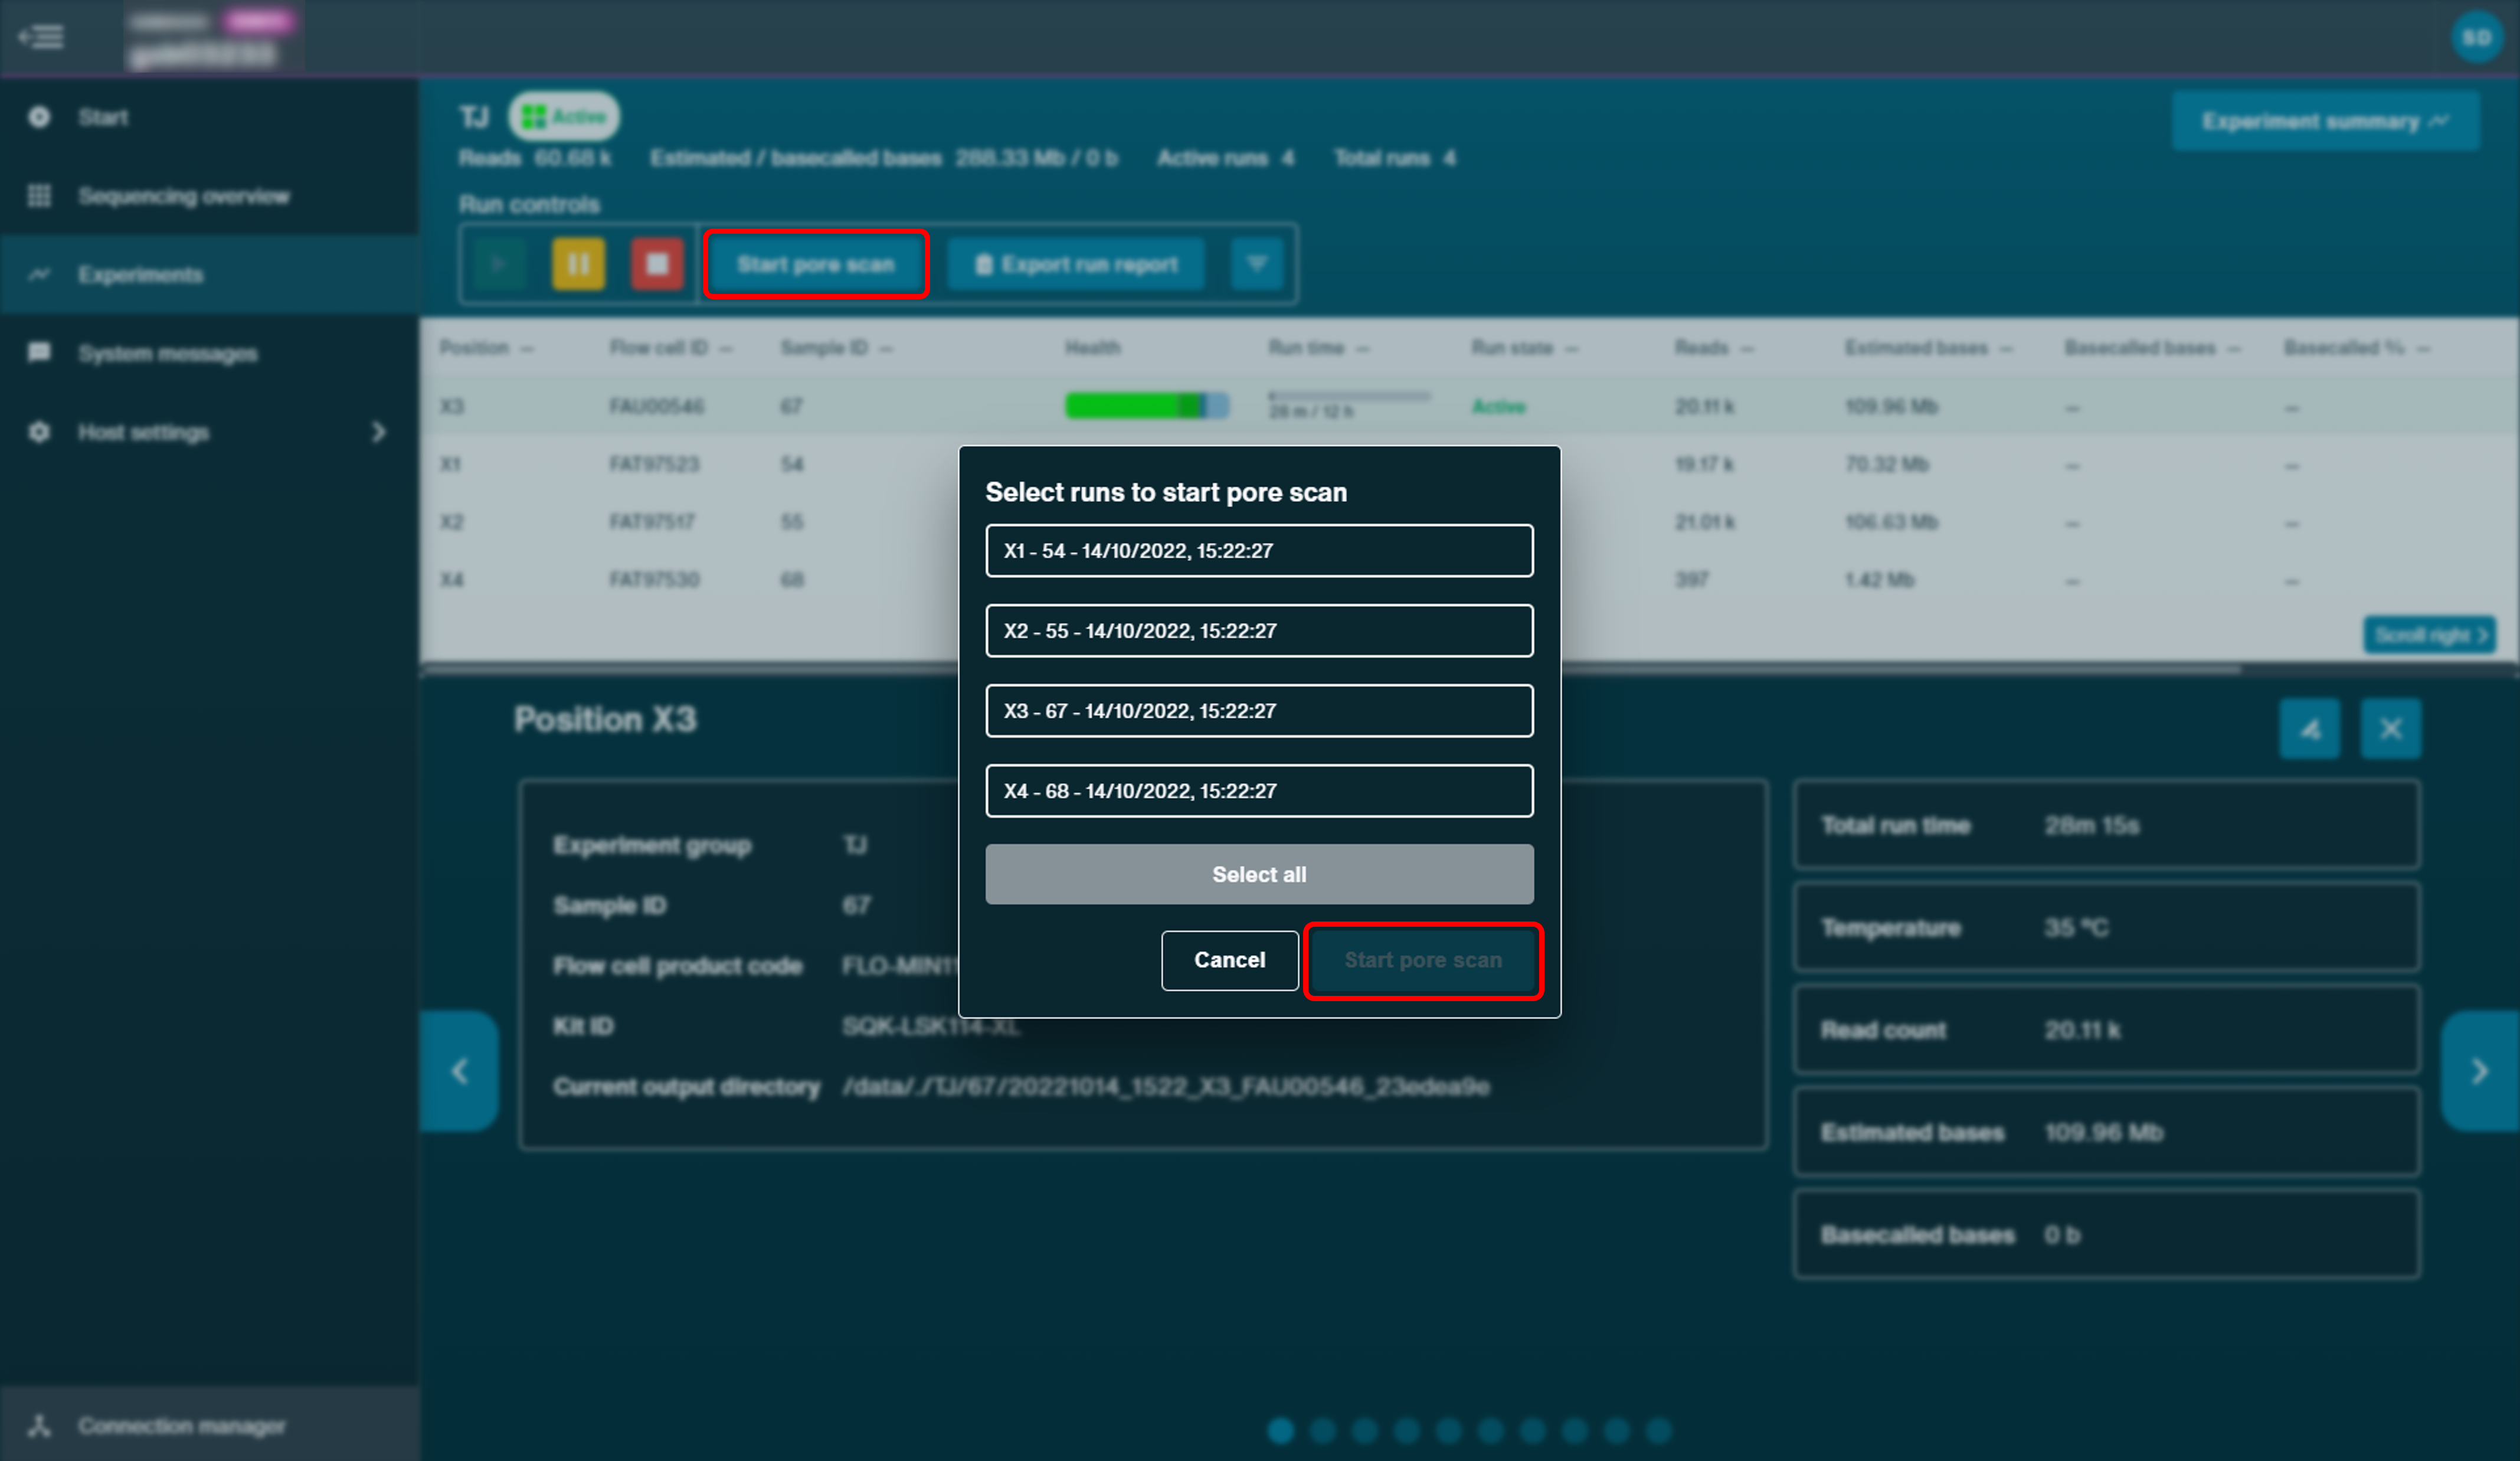
Triggering a pore scan
The pore scan is used to assess the quality of the four wells in each channel to select the best performing pores. A new pore scan can be triggered every time a sequencing experiment is resumed after a pause (e.g. for a flow cell wash), or if the number of sequencing pores has significantly dropped during an experiment.
Navigate to the Experiments page, open a specific run, and click Start pore scan in the run controls. Confirm the flow cell to be scanned and click Start pore scan.