-
During the sequencing experiment, you can check various flow cell health and performance parameters that are shown in the MinKNOW GUI. Each parameter is described in more detail in this section.
-
Flow cell health
During a sequencing experiment, the MinKNOW Sequencing Overview page shows a flow cell icon with coloured bars. The bars represent the combined health of all pores in a flow cell, and indicate how well the flow cell is performing. The colours are:
- Light green: sequencing
- Dark green: open pore
- Dark blue: pore recovering
- Light blue: pore inactive
This information is identical to the last bar of the pore activity plot (described later).
a) Flongle/MinION/GridION flow cell health
b) PromethION flow cell health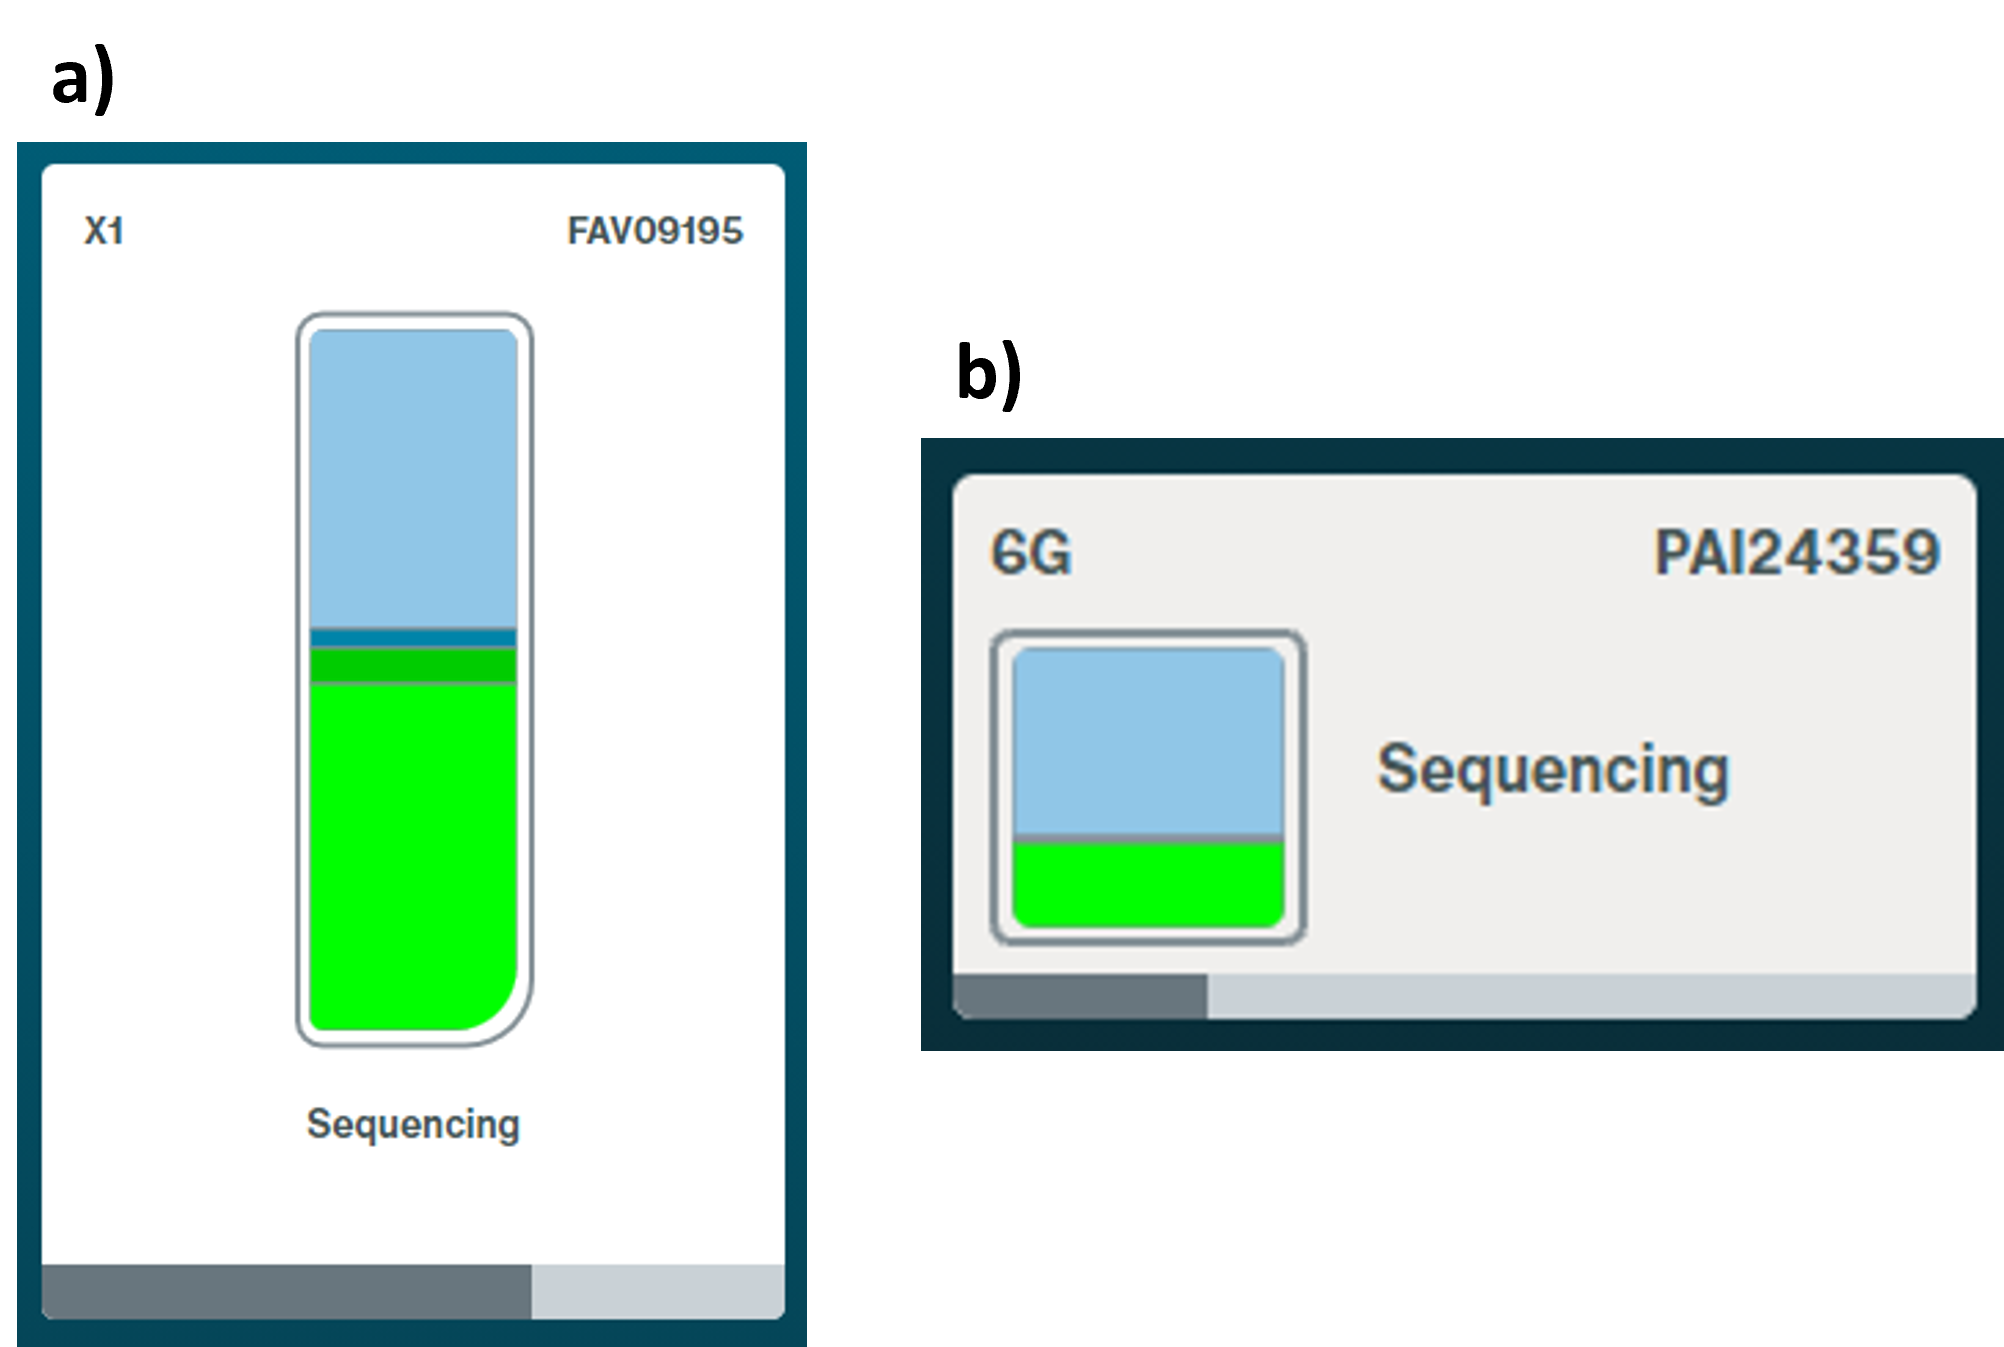
-
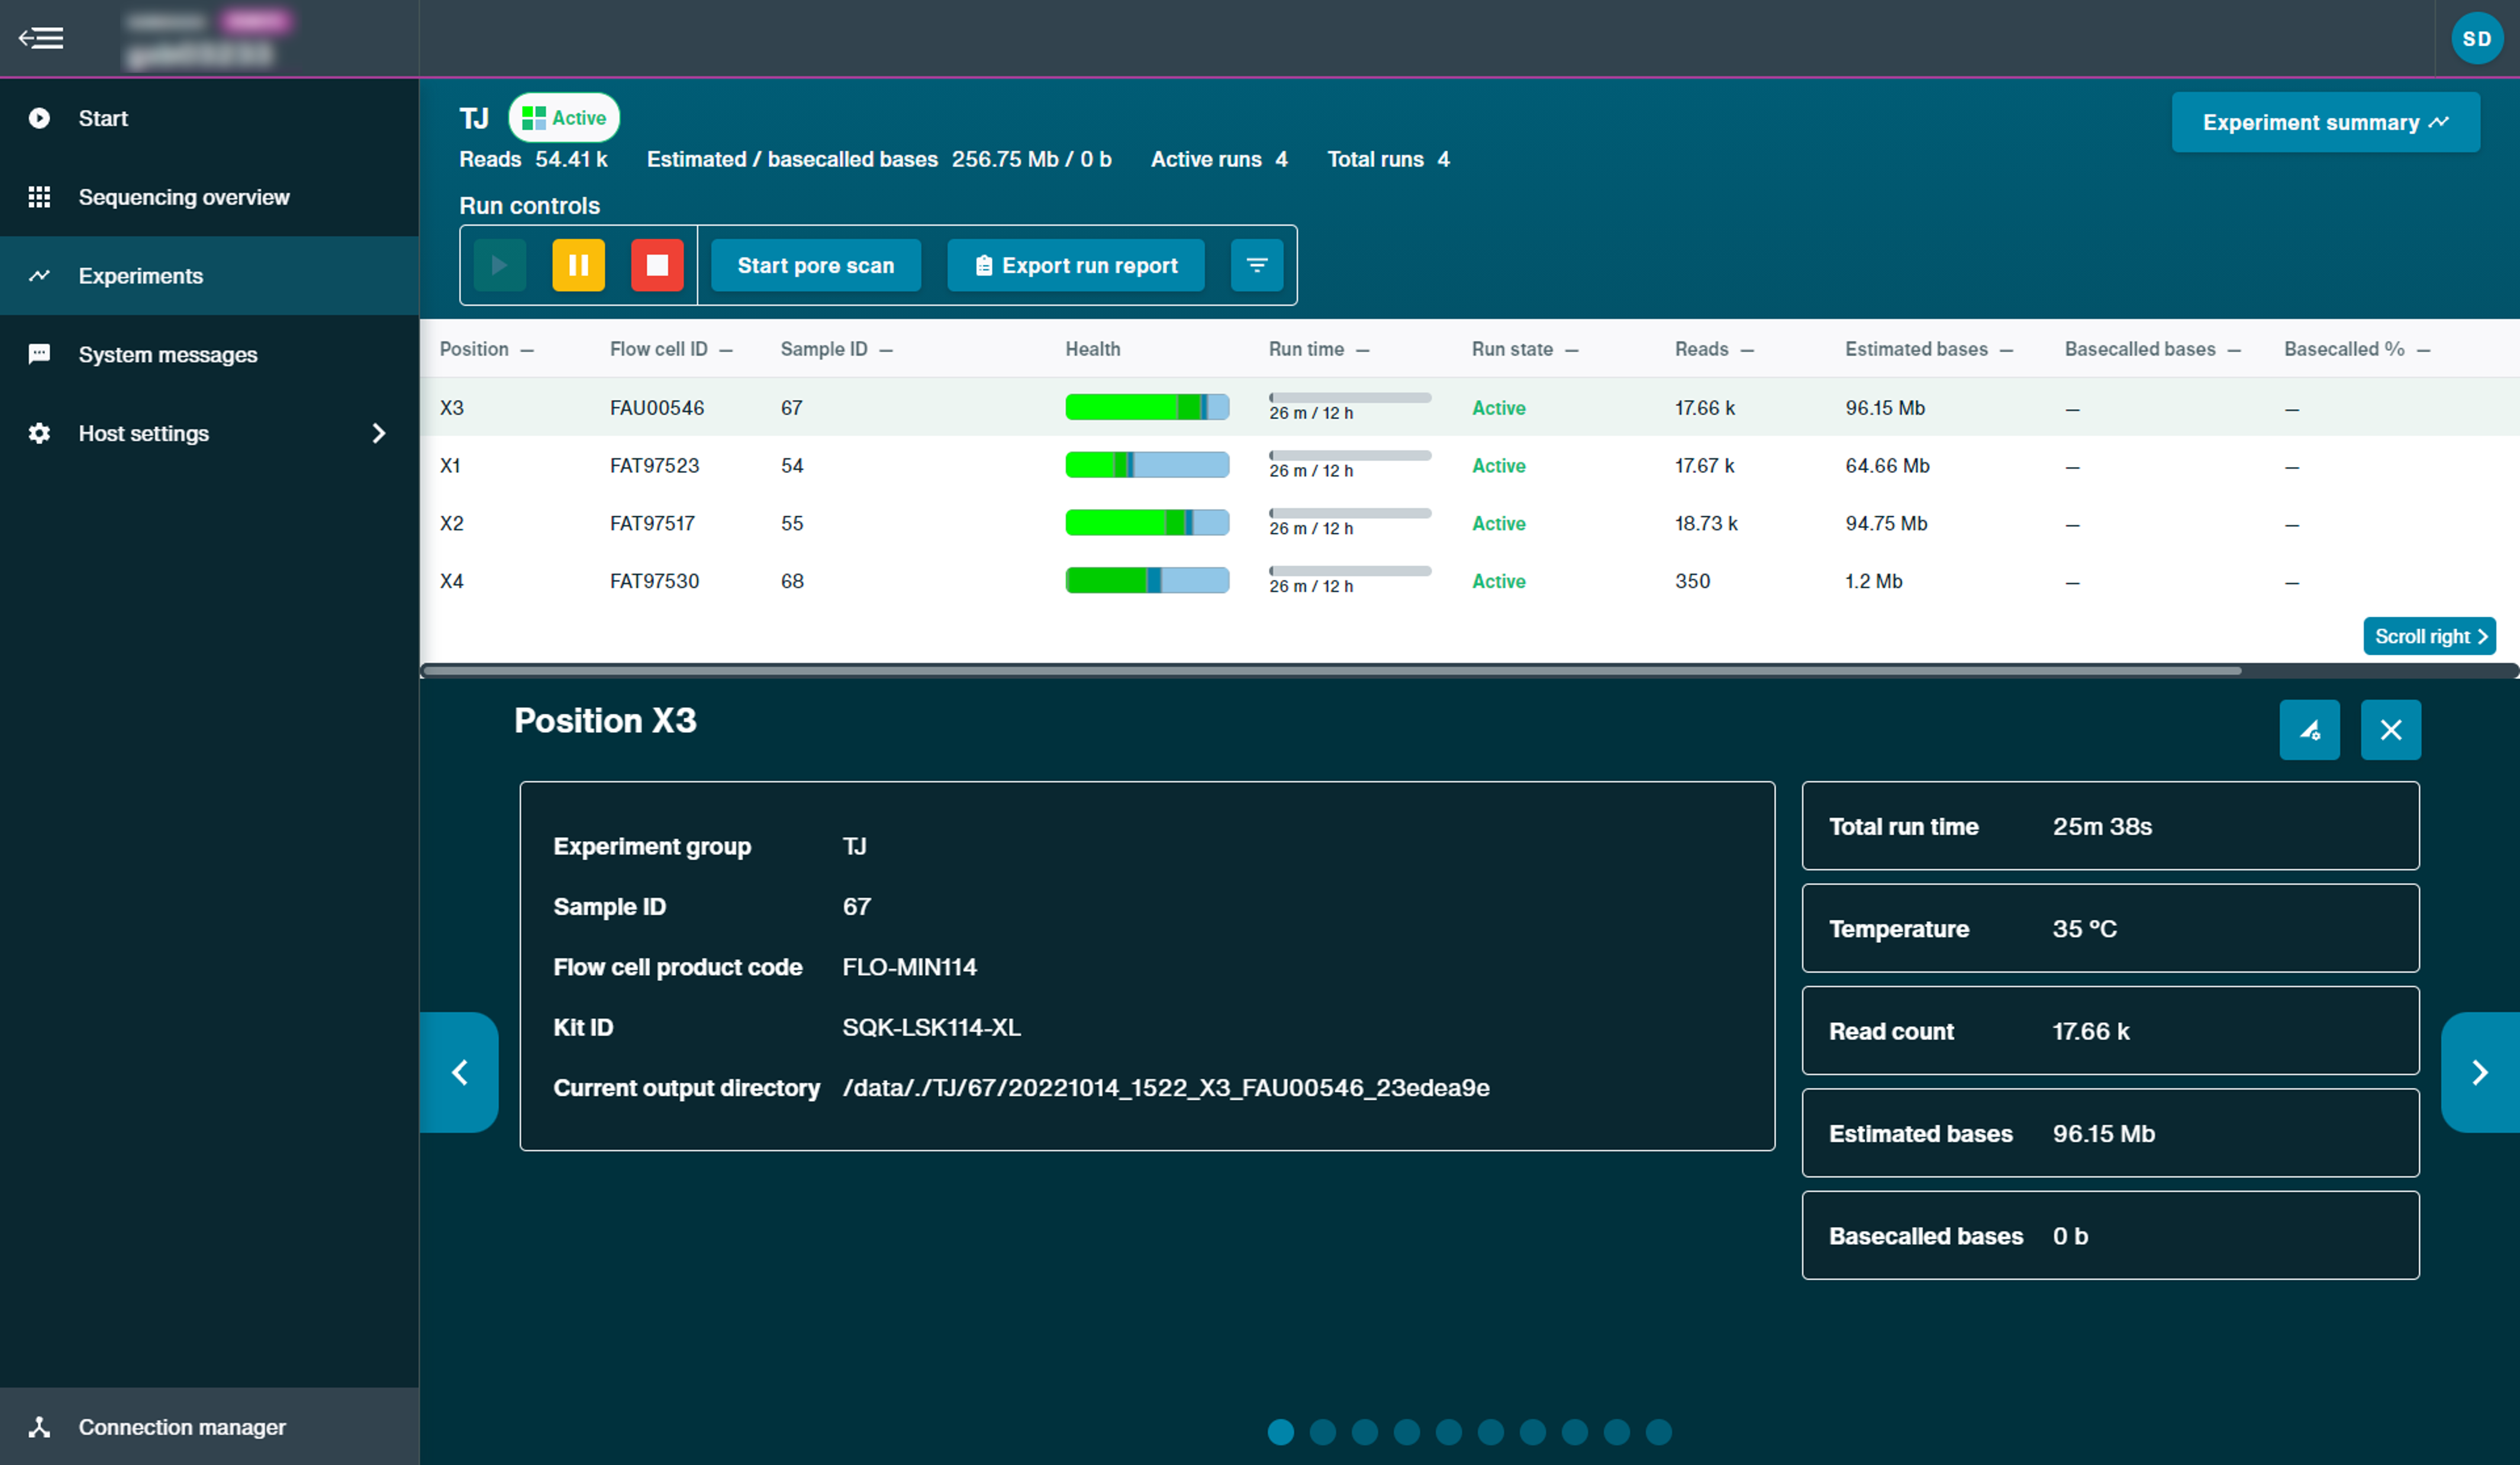
Experiment summary information
The Experiments page displays summary information for all sequencing flow cells and device checks carried out on the device.
From this page, the user is able to control specific runs and identify real-time information including flow cell health and reads, giving users real-time feedback for sequencing flow cells.
- Read count: The total number of reads across the experiment.
- Estimated bases: The number of estimated bases to be basecalled from the experiment
- Basecalled bases: The number of basecalled bases from the experiment.
- Total run time: The duration of the experiment.
- Temperature: The heatsink temperature of the selected position, which for sequencing should reach 34°C with Kit 9-11, 30°C with Kit 12 or 35°C on Flongle. For Kit 14, sequencing temperature is approximately 36°C.
-
Channel states
The channel states pannel gives an overview of the states the flow cell pores are in to give the user an idea of how well the sequencing run is performing in real time. A good library will be indicated by a higher proportion of light green channels in "Sequencing" than are in "Pore available". The combination of "Sequencing" and "Pore available" indicates the number of active pores at any point in time. A low proportion of "Sequencing" channels will reduce the output of the run.
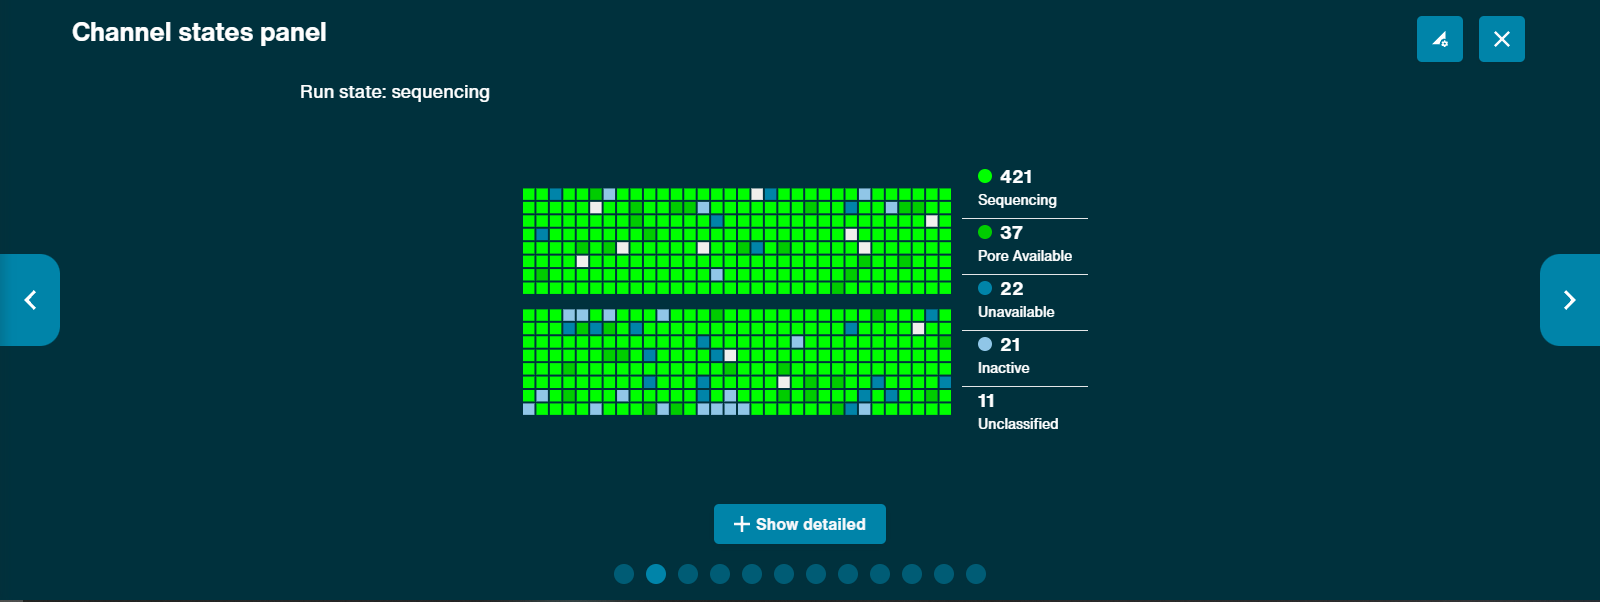
Clicking on the Show Detailed button reveals a more detailed array of channel states:
- Sequencing: Pore currently sequencing.
- Pore Available: Pore available for sequencing.
- Adapter: Pore currently sequencing adapter.
- Active feedback: Channel ejecting analyte.
- No pore: No pore detected in channel.
- Multiple: Multiple pores detected. Unavailable for sequencing.
- Unavailable: Pore unavailable for sequencing.
- Unclassified: Pore status unknown.
- Saturated: The channel has switched off due to current levels exceeding hardware limitations.
- Out of range-high: Current is positive but unavailable for sequencing.
- Out of range-low: Current is negative but unavailable for sequencing.
- Zero: Pore currently unavailable for sequencings.
-
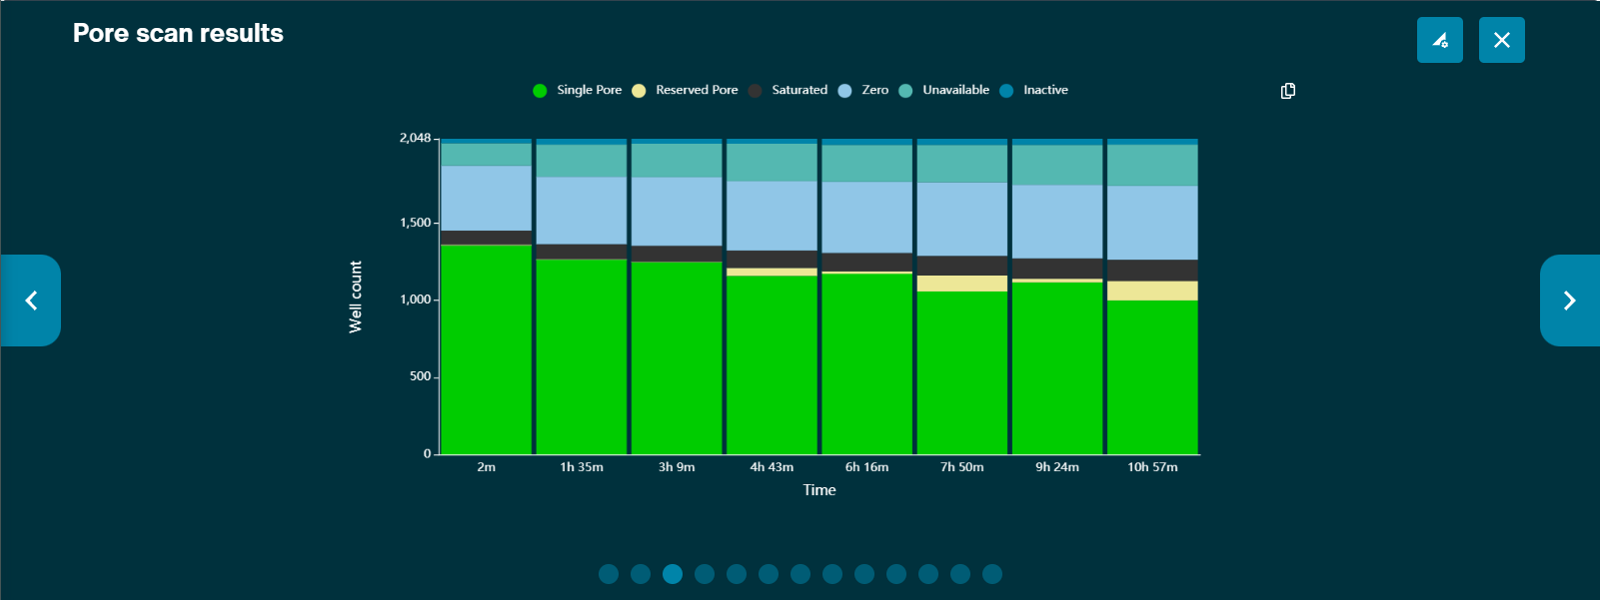
Pore activity plots
The pore activity plot summarises the channel states over time. Each bar shows the sum of all channel activity in a particular amount of time. This time bucket defaults to 1 minute, and scales to 5 minutes automatically after 48 minutes. However, bucket size can be adjusted in the "Bucket size" box in Display Settings.
The graph populates over time, and can be used as a way to assess the quality of your sequencing experiment, and make an early decision whether to continue with the experiment or to stop the run.
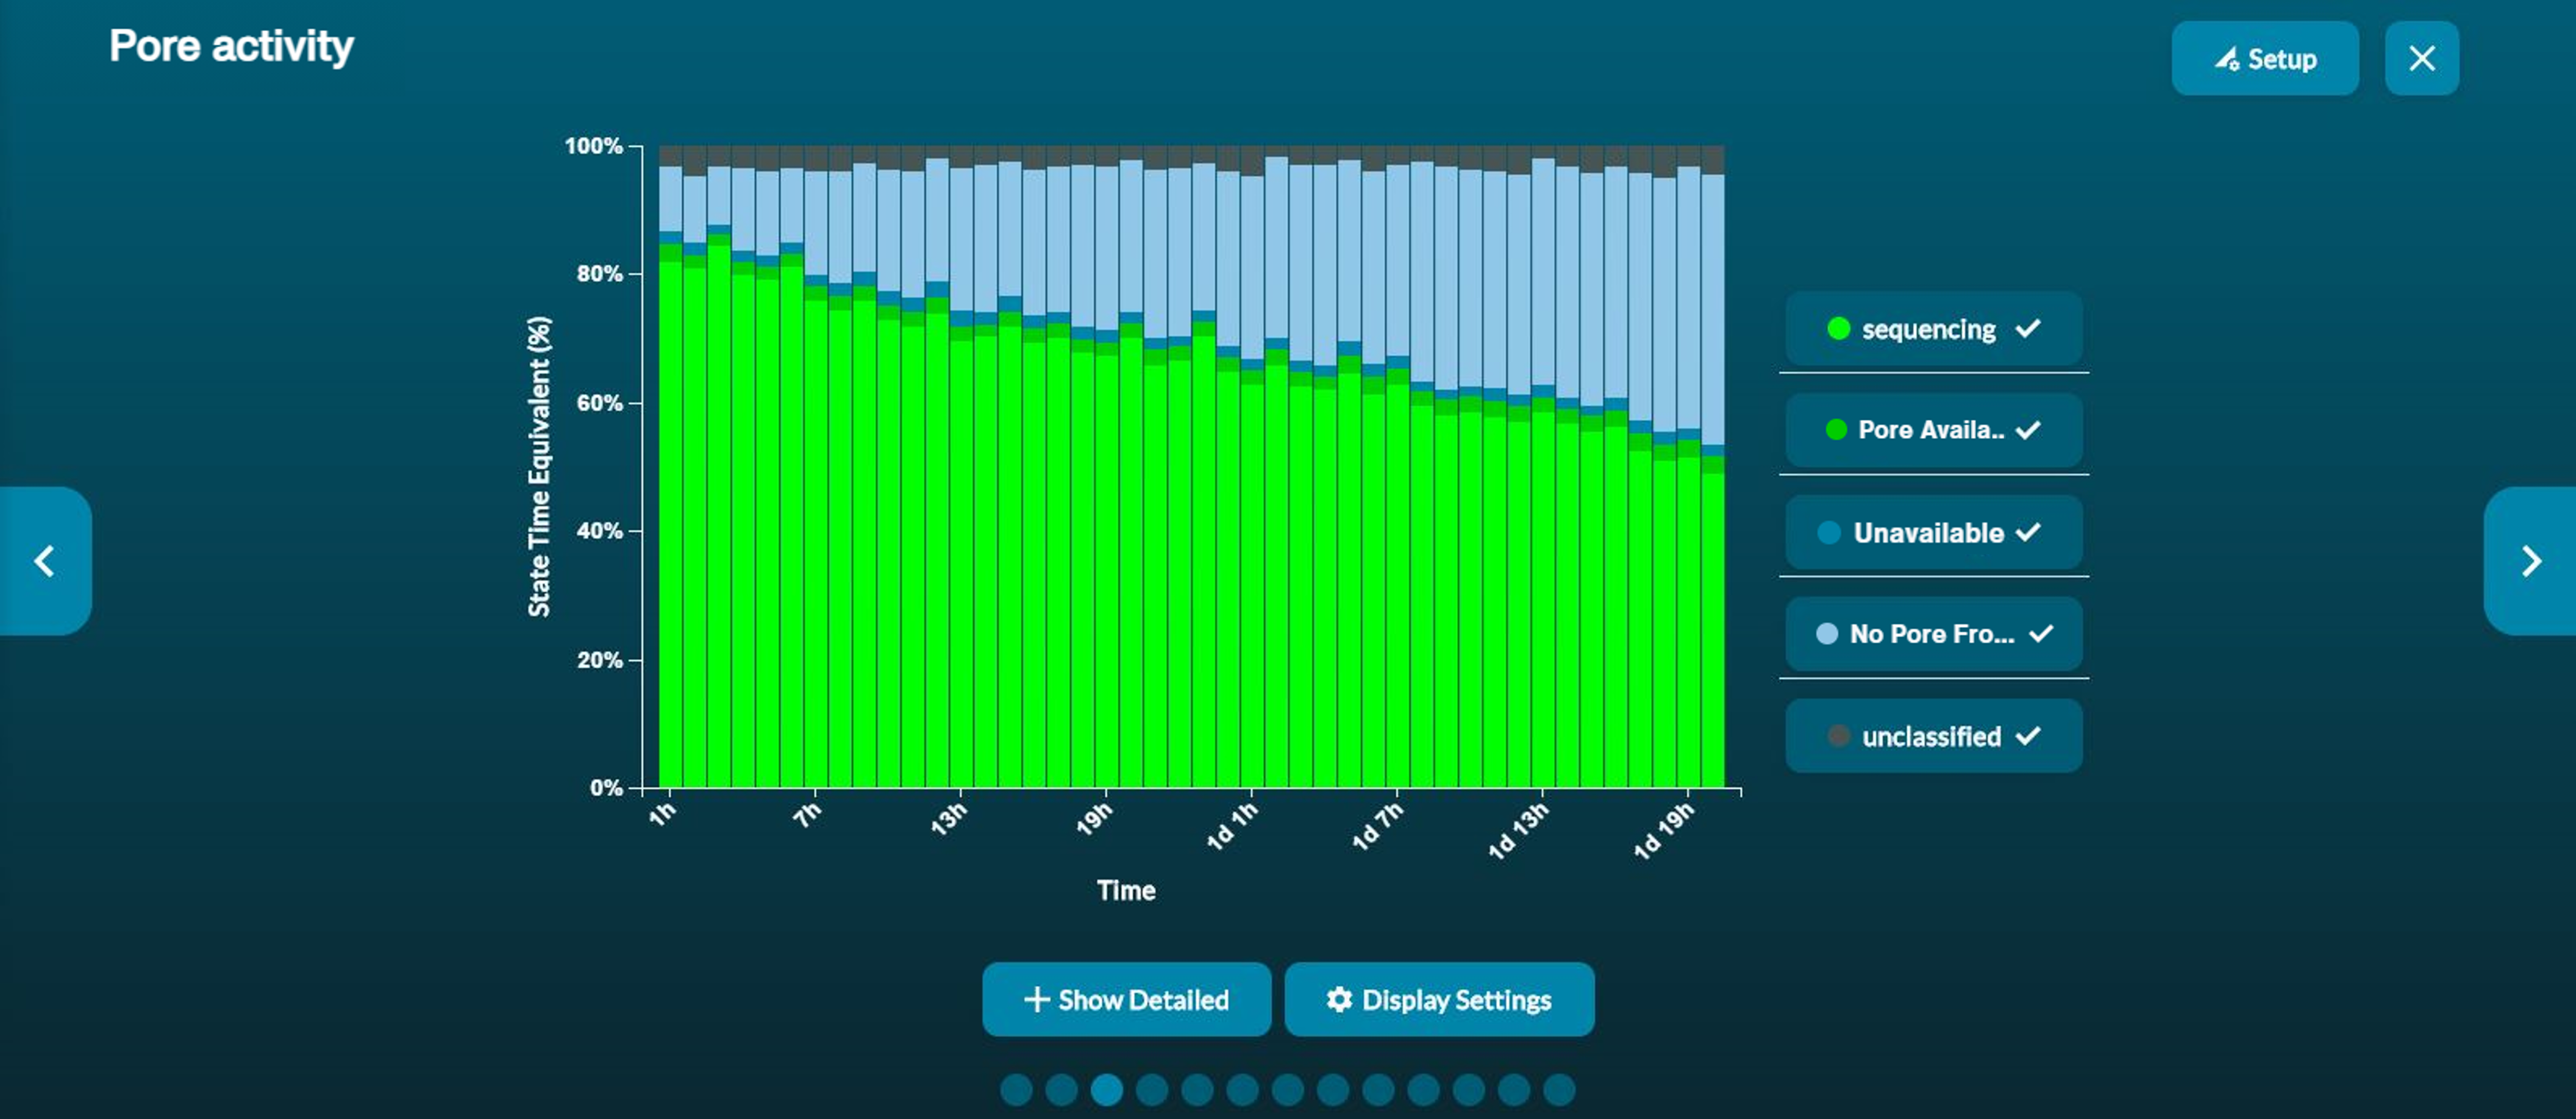
To see the more detailed view of channel states, click Show detailed.
- Sequencing: Pore currently sequencing.
- Adapter: Pore currently sequencing adapter.
- Pore available: Pore available for sequencing.
- Unavailable: Pore unavailable for sequencing.
- Active feedback: Channel ejecting analyte.
- No pore: No pore detected in channel.
- Out of range-high: Current is positive but unavailable for sequencing.
- Out of range-low: Current is negative but unavailable for sequencing.
- Multiple: Multiple pores detected. Unavailable for sequencing.
- Saturated: The channel has switched off as current level exceed hardware limitations.
- Zero: Pore currently unavailable for sequencing.
- Channel disabled: Channel is disabled and awaiting another pore scan.
-
Read length histogram
The cumulative histogram shows reads compared to bases. Use the options below to choose the axis legends:
- Y-axis: Estimated bases or basecalled bases
- X-axis: Read length or read counts
Read count - this shows the number of reads vs read length. This enables you to understand how the read lengths vary in number and size.
Read length - this shows the total number of bases vs the read length.
The N50 value is presented (only for the whole set of passed reads) in the top left corner of the histogram.
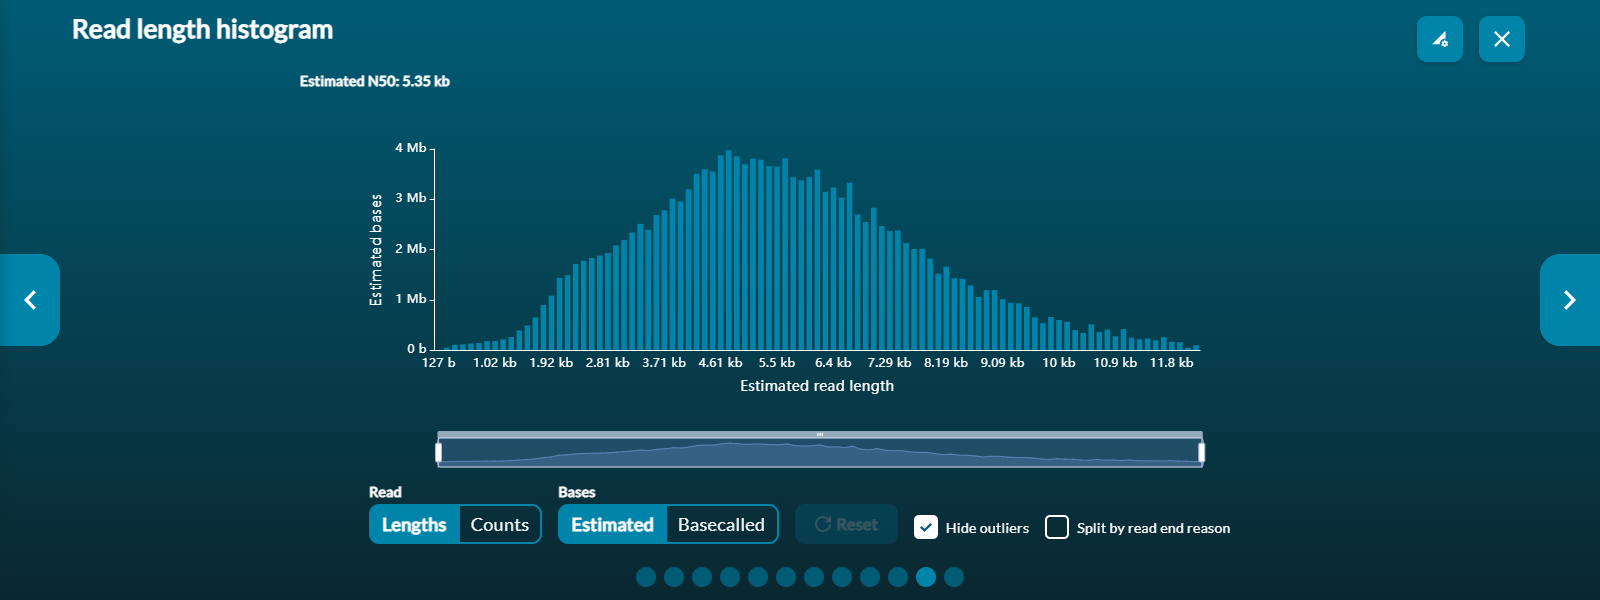
Each histogram's X-axis (read length) can be zoomed in using the scaled bar under the histogram. Use Reset to refocus the zoom bar and histogram for the entire 'passed read' dataset.

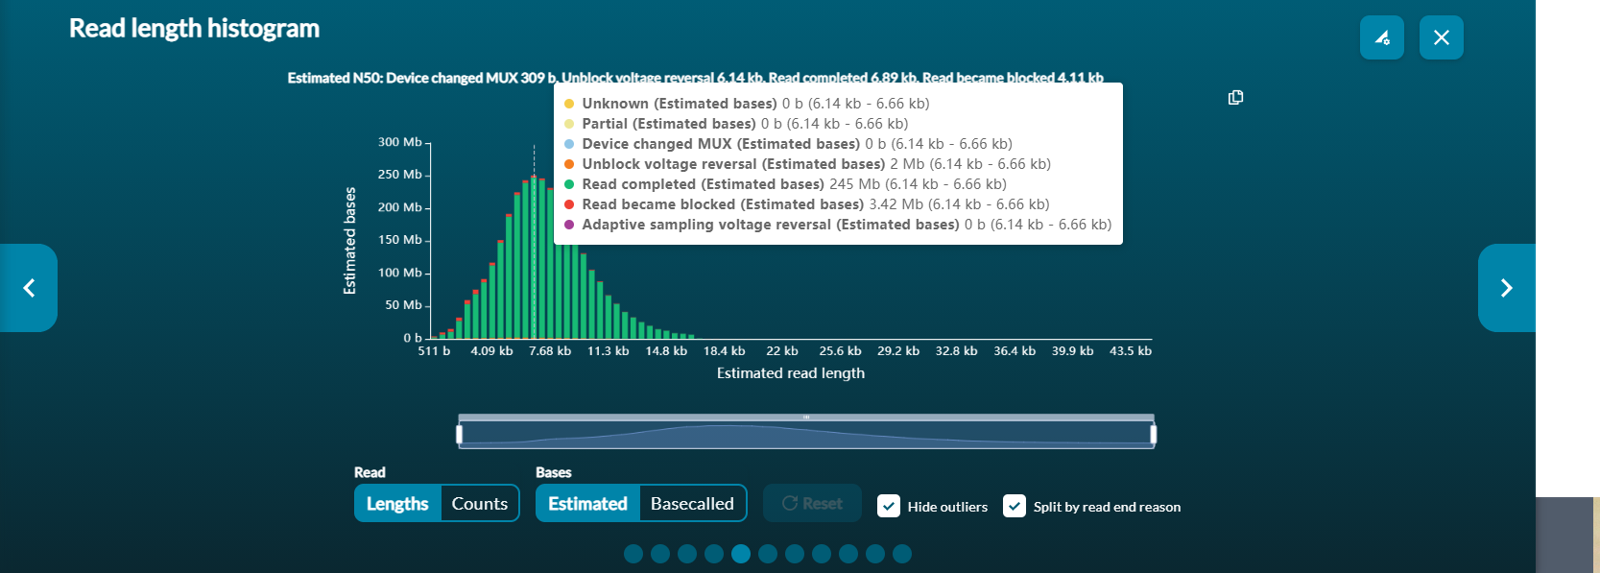
You can see the number of bases by hovering over the bar in question.Reads that are outliers in terms of length can be removed from the graph by ticking the Hide outliers box below the histogram.
Select Split by read end reason to view split reads and hover over for further information. This is useful for adaptive sampling which is further explained in the Adaptive Sampling info sheet.
- Device changed MUX/Pore scan initiated: The strand ended because there was a scheduled pore scan that interrupted the read.
- Read completed: The strand ended naturally as it passed through the pore.
- Read blocked: The strand ended because it was deemed of low quality and purposefully rejected.
- Adaptive sampling voltage reversal/Adaptive sampling rejection: The strand was rejected by adaptive sampling because it did not align to the target sequence when enriching, or the strand matched to the target sequence when depleting.
-
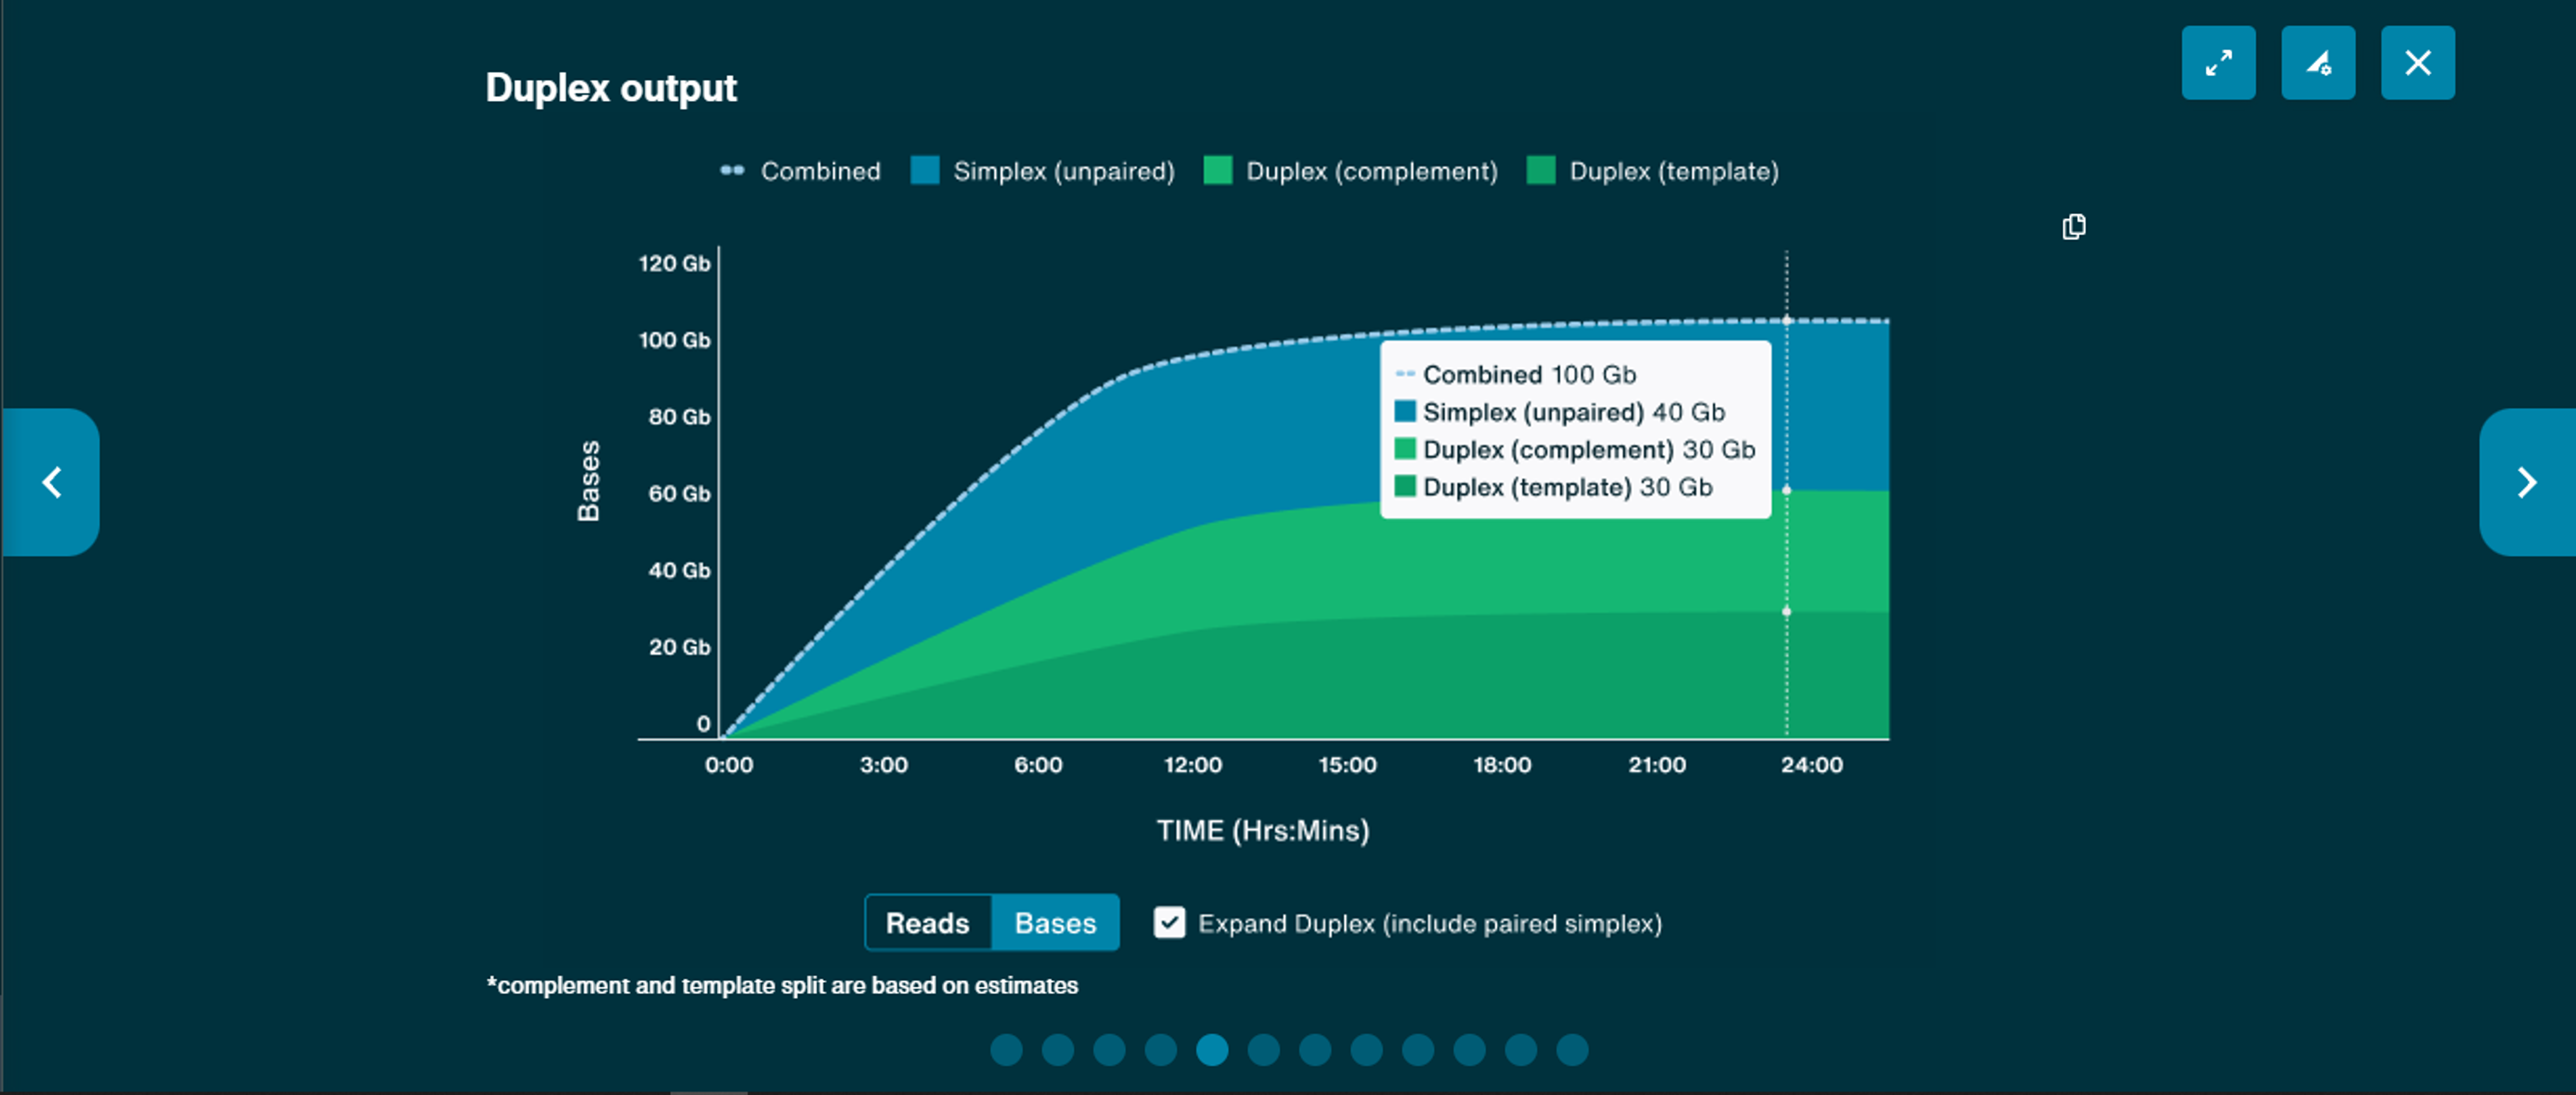
Duplex output
This graph is available to display cumulative output of both simplex and duplex data, including unpaired and, optionally, paired simplex data. Data output can be displayed as bases or reads.Note, the complement and template split in the graph are based on estimates.
Note: This graph is only available when duplex basecalling is turned on and HD flow cells (R10.4.1HD) are used.
-
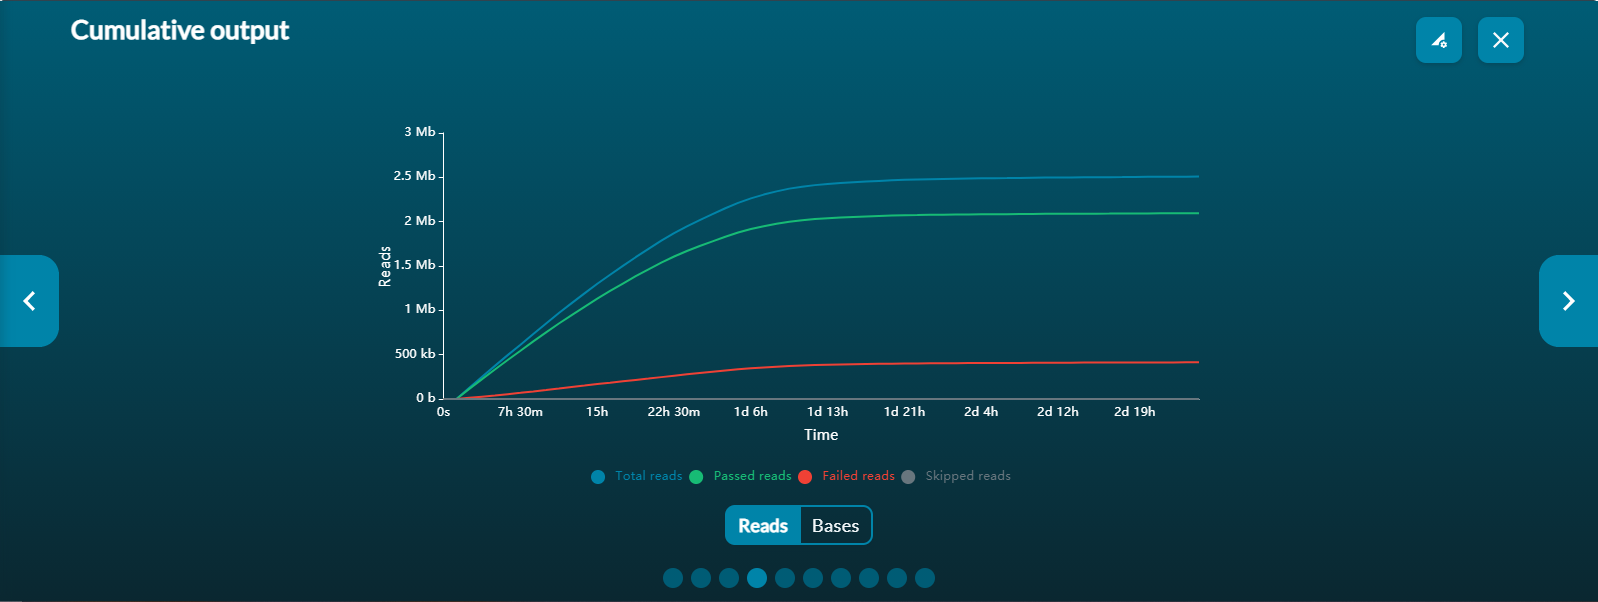
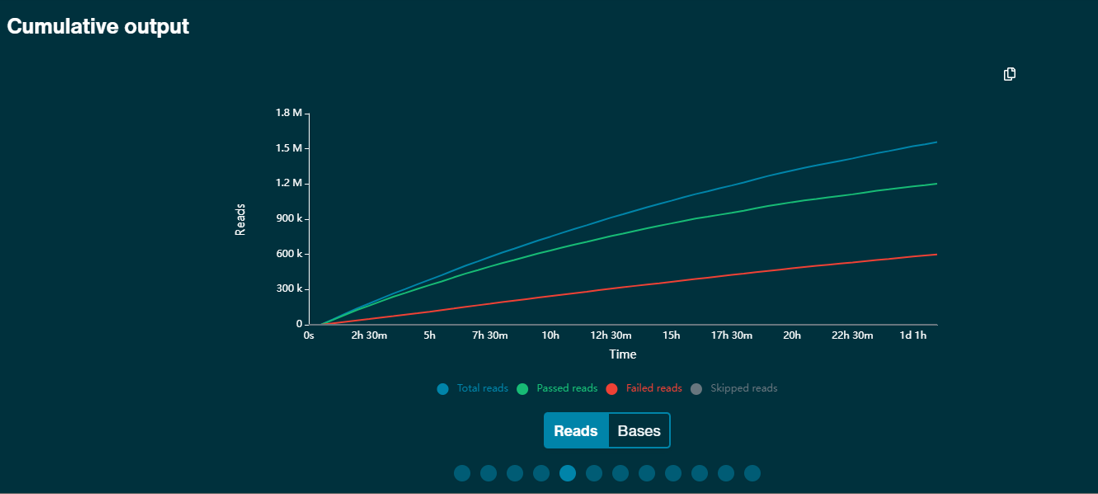
Cumulative output
The cumulative output graph shows:
- the number of bases that have been sequenced and basecalled
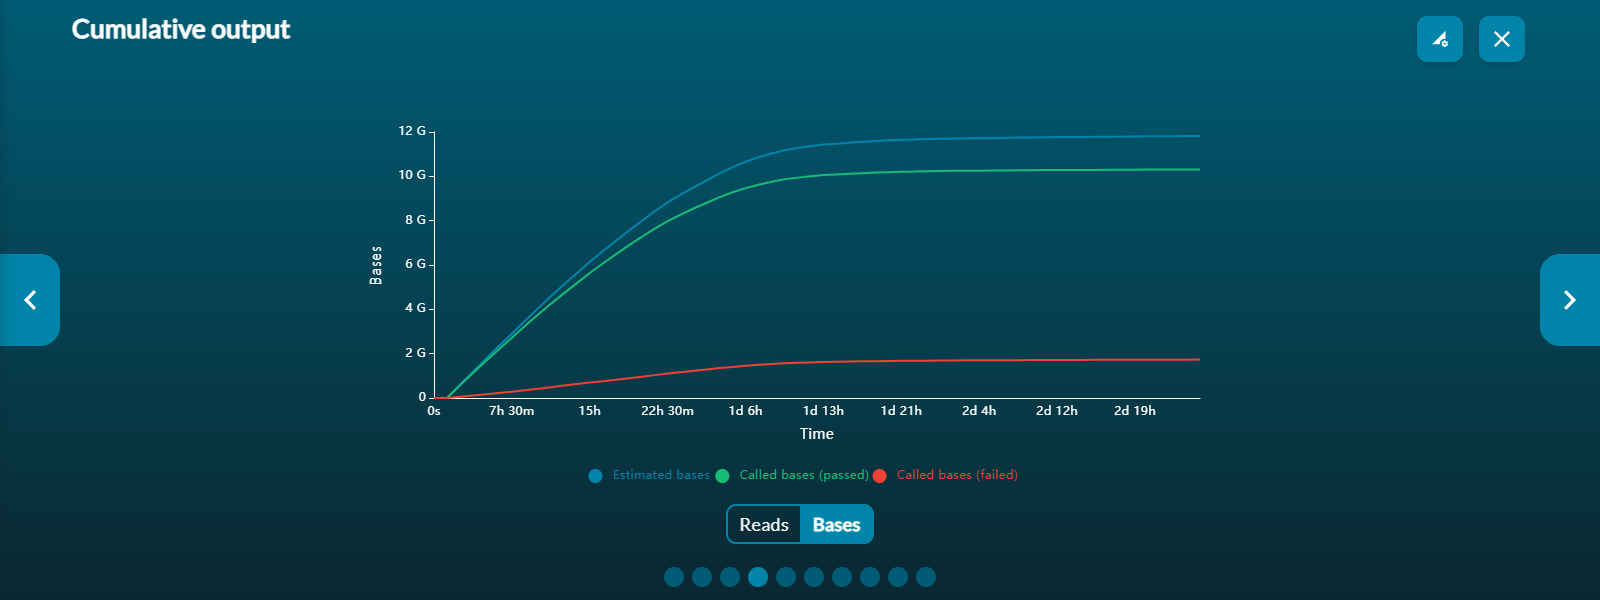
- the number of reads that have been sequenced and basecalled; and whether the reads have passed of failed the quality filters
-
Cumulative output of multiple flow cells
If there are multiple flow cells running under the same experiment name, you will see the Experiment view. This gives output information on all assigned flow cells, plus a running cumulative total of bases or reads sequenced.
The cumulative output graph shows the running total number of Gbases sequenced by the GridION.
The output generated by each flow cell to make the total cumulative output can be represented by individual output plots.
Both graphs can be switched between in the MinKNOW GUI. Reads, bases (estimated or basecalled) depending on the name, sample ID or flow cell ID can be selected to tailor the output graph, as required.
-
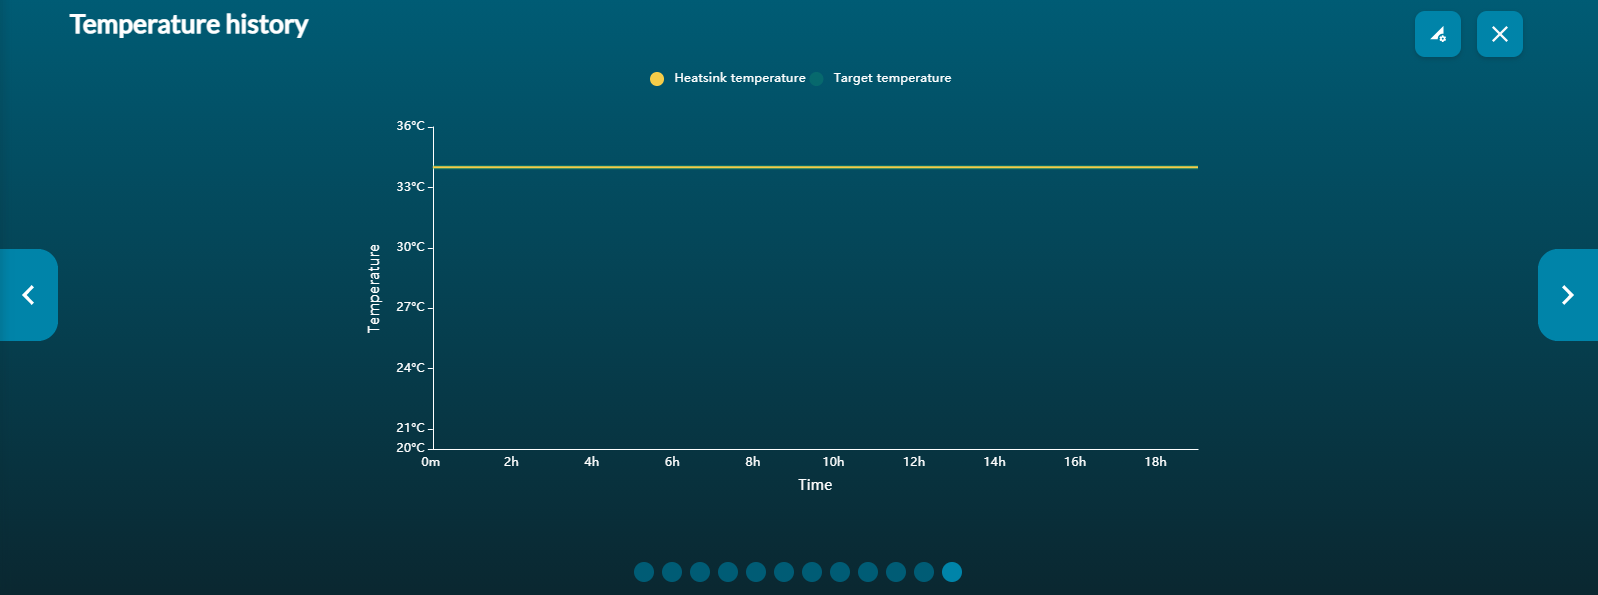
Temperature and Bias Voltage graph
Temperature vs time graph
The temperature graph gives a real-time representation of the heatsink temperature of the flow cell. If the temperature reading drifts out of the target zone, please consult Technical Services, otherwise the quality of your data may be compromised.
Please note, for our kits using Kit 14 chemistry, there will be some temperature fluctation at the beginning of the run due to speed normalisation.
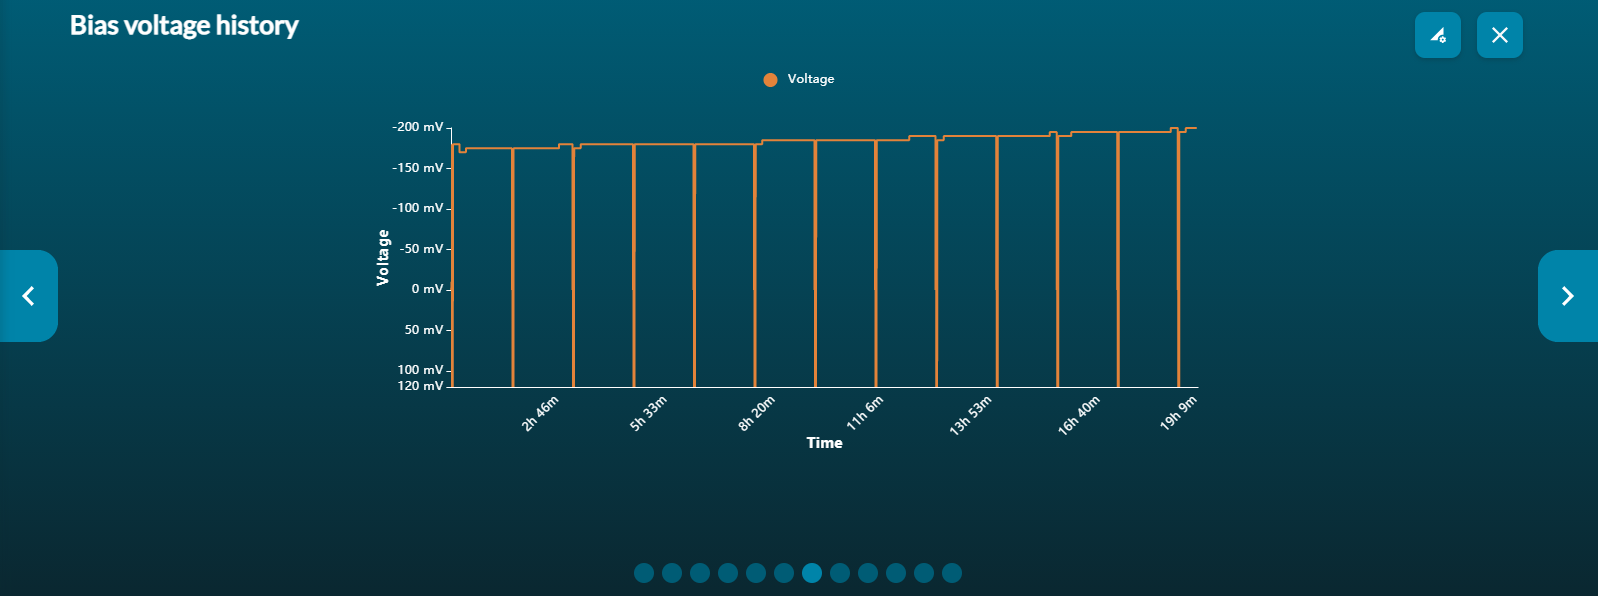
Bias voltage vs time graph
The bias voltage graph provides the running voltage in real-time. MinKNOW will automatically adjust the applied voltage and will naturally drift to lower voltages as the electrochemistry in the flow cell is depleted. This graph is useful for running a flow cell multiple times.
If you set the voltage for a subsequent run as the final running voltage of the previous run, then MinKNOW will find it easier to identify the appropriate running voltage.
You will notice drops in the voltage at regular intervals and these will correspond to the channel scans that are defaulted to occur every one and a half hours. Here, each channel will be scanned to look for its availability for sequencing. The common voltage is reversed before and after each channel assessment for clearer results.
-
Translocation speed and quality score graphs
Note: These graphs are only present if Basecalling is turned on.
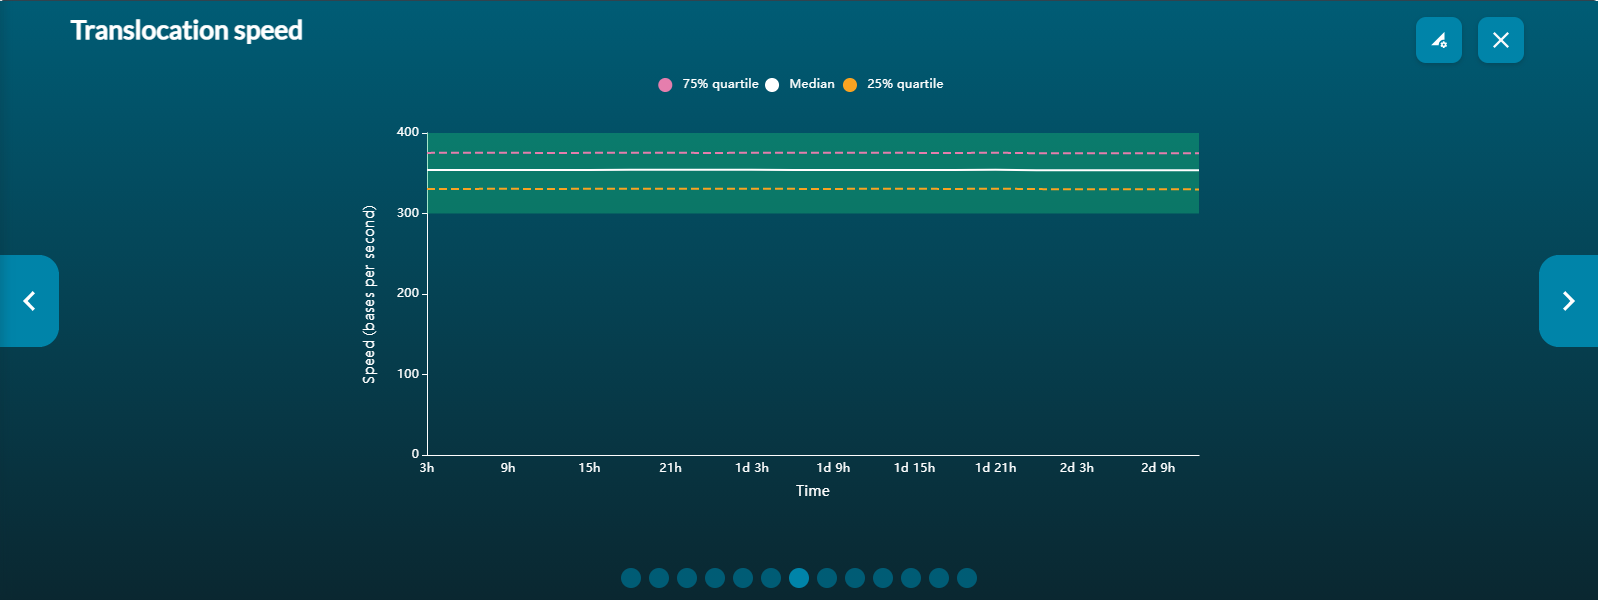
Translocation speed vs time
The translocation graph gives a real-time representation of the speed at which DNA/RNA strands pass through the pore. If the translocation speed drops below this window, data quality and output may be compromised as strands take longer to move through the pore.
Please note, translocation speed will be dependent on the kit chemistry used.
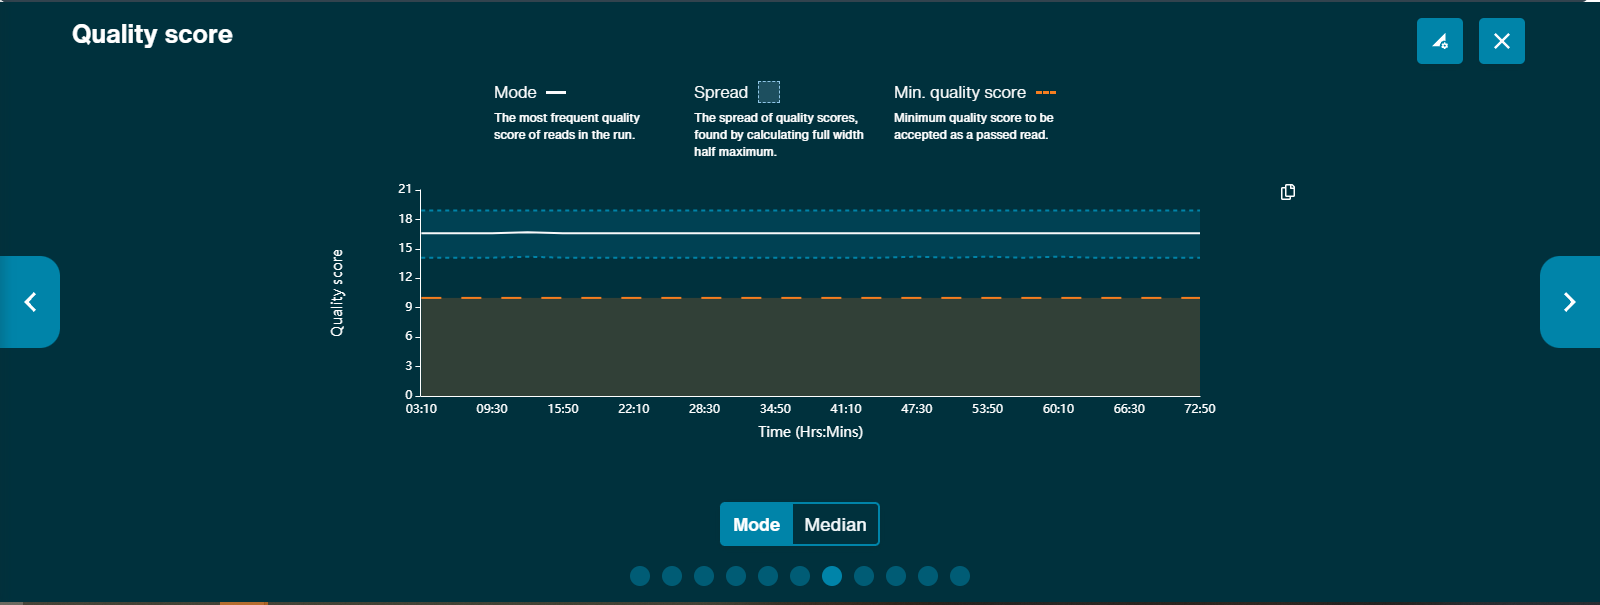
Quality score vs time
The Quality score graph gives a live representation of the median strand Q-score over time.
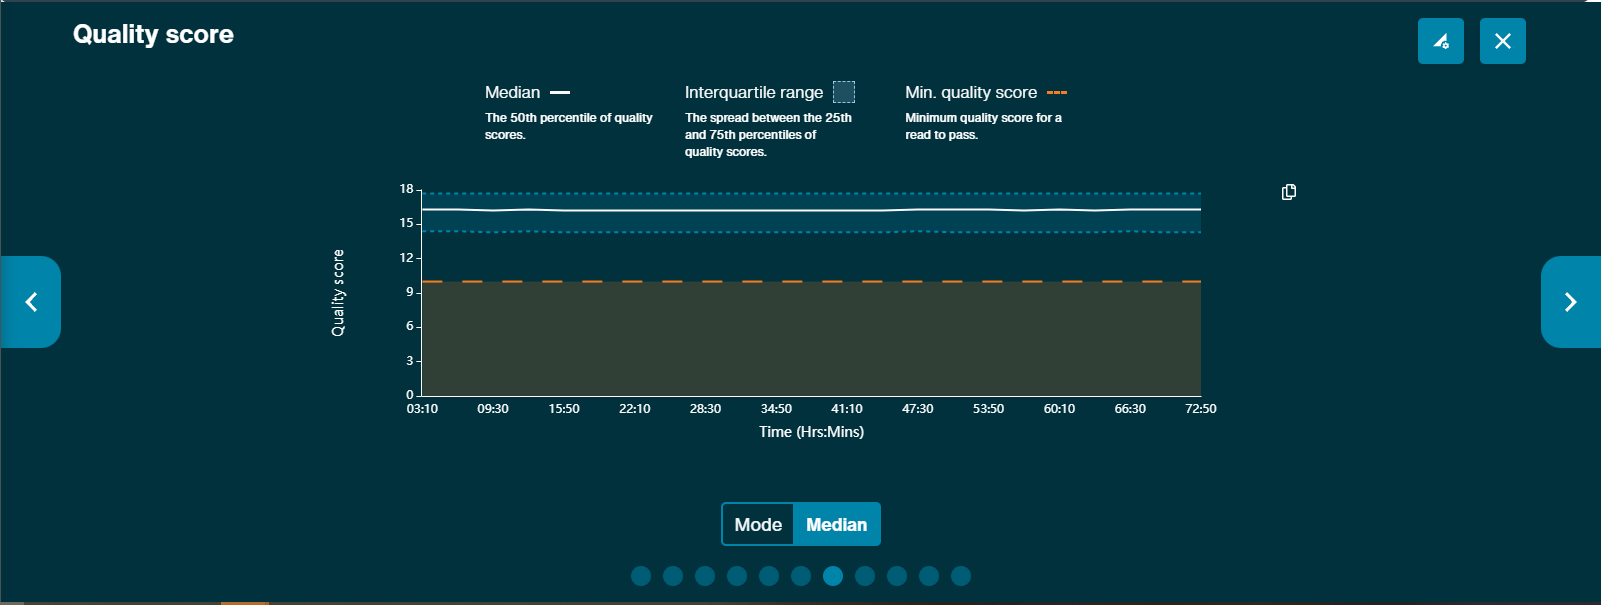
Modal quality score graph is available across the run. This graph presents both the spread of quality scores and the modal quality score across the run, and the minimum quality score set.
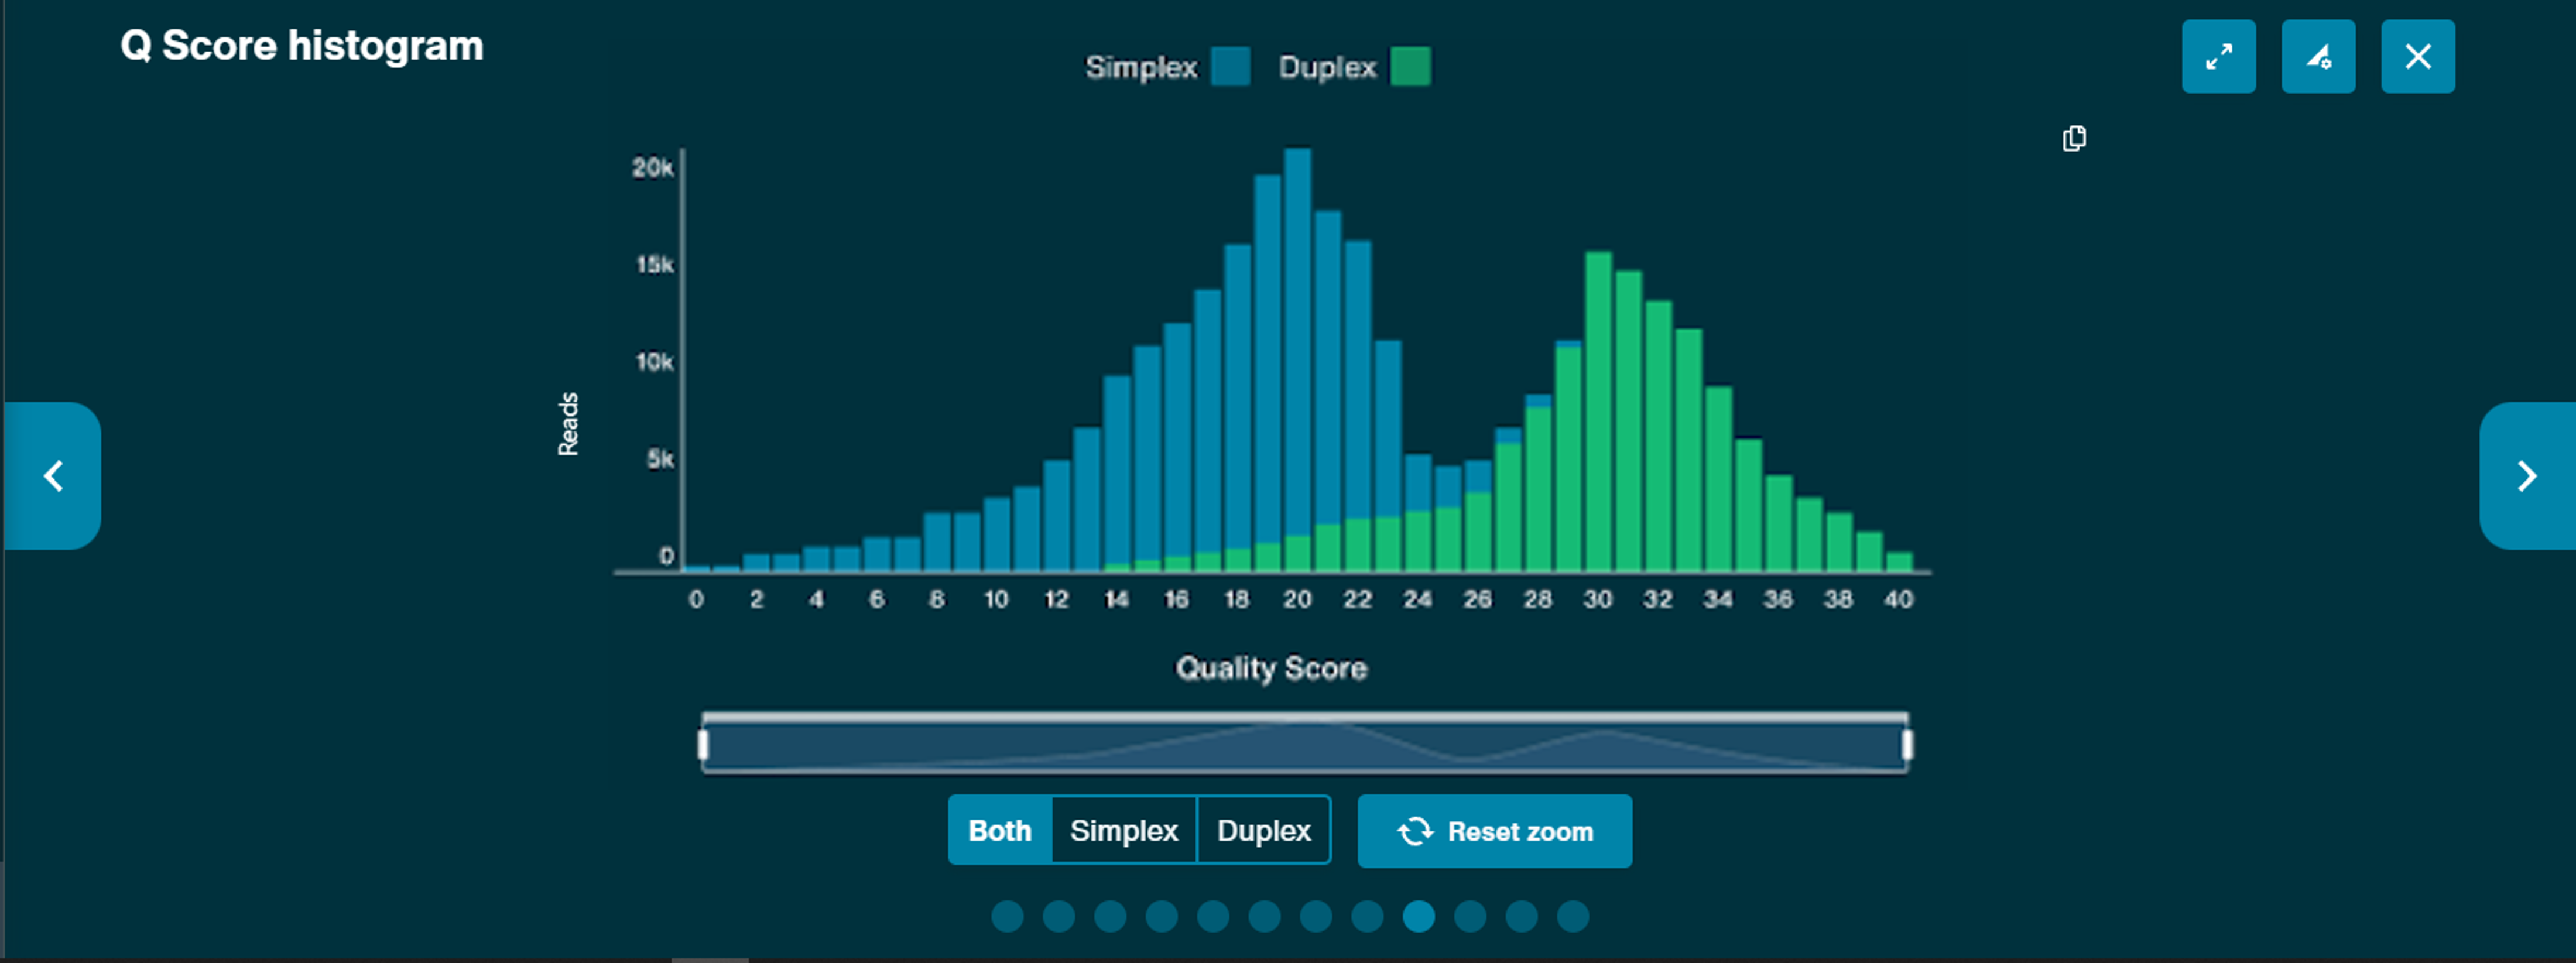
Q score histogram
This Q score graph will be generated over time. Both simplex and duplex Q score can be viewed and there is a zoom function available in the X-axis.
-
Barcode read counts
The Barcode Read Counts graph shows the breakdown of barcoded reads, if barcoding was used for the experiment. The default view only shows reads that have passed the quality score filters. However, selecting the Display failed box will show all reads.
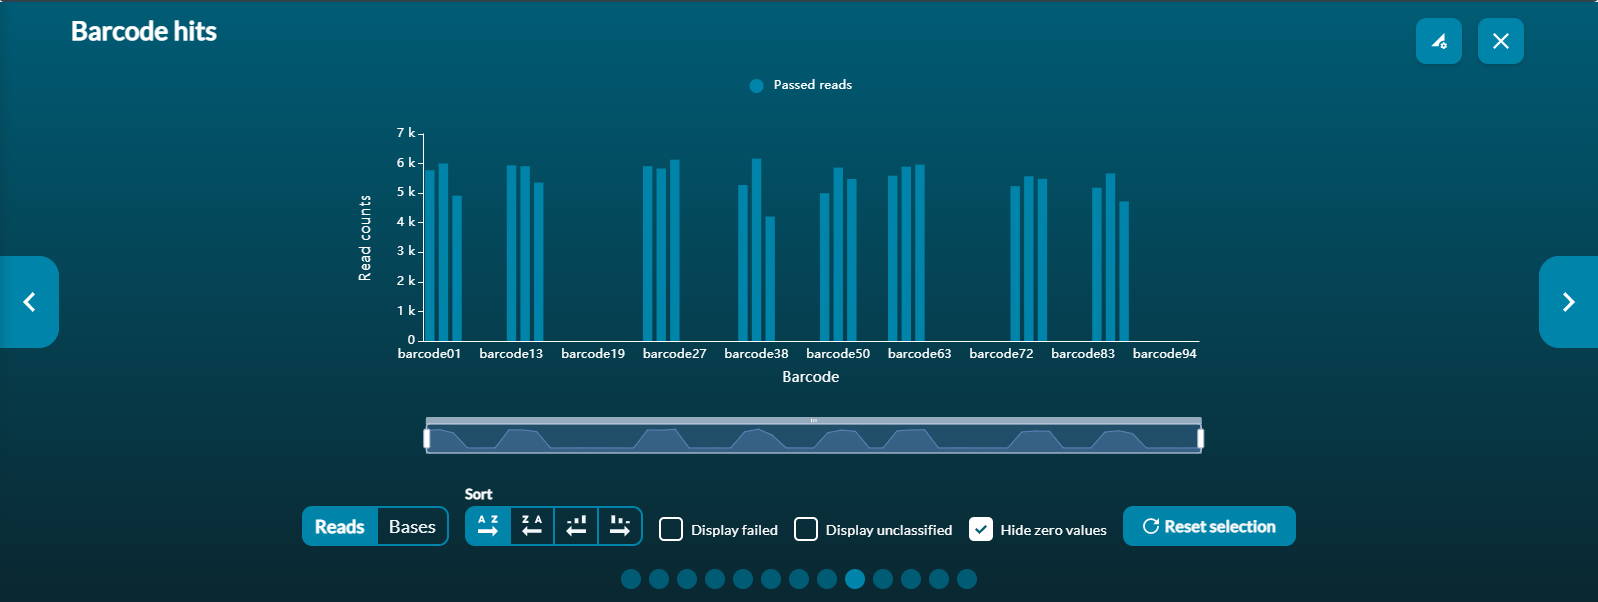
The X-axis of the histogram also has a zoom function using the scaled bar underneath. Use Reset to refocus the zoom bar and graph.
Note that there is a small amount of cross-talk between barcodes. Some barcoded reads may appear on the graph even if the barcode in question was not used for the experiment.
Note: This graph is only present if barcoded is turned on.
-
Alignment hits
The alignment hits graph will populate when alignment and basecalling is set-up to run during sequencing. This bar graph shows the number of reads and bases that align to each of the entries in the user reference .fasta file or minimap index file. An entry in the reference file will only appear on the graph once a single read has aligned to it.
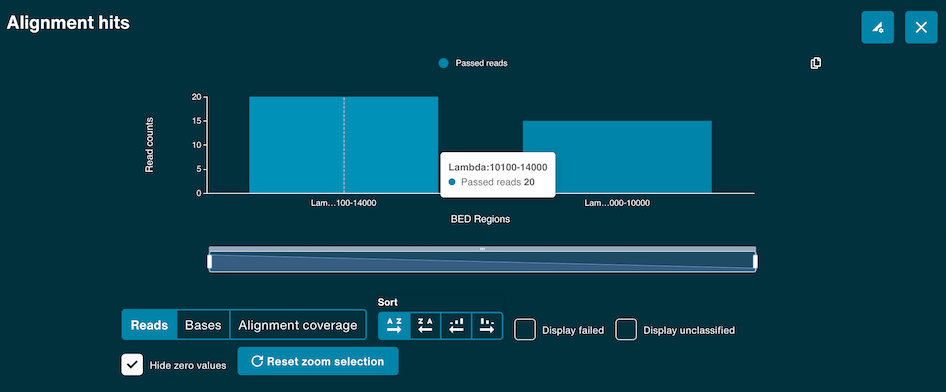
The X-axis of the histogram also has a zoom function using the scaled bar underneath. Use the Reset to refocus the zoom bar and graph.
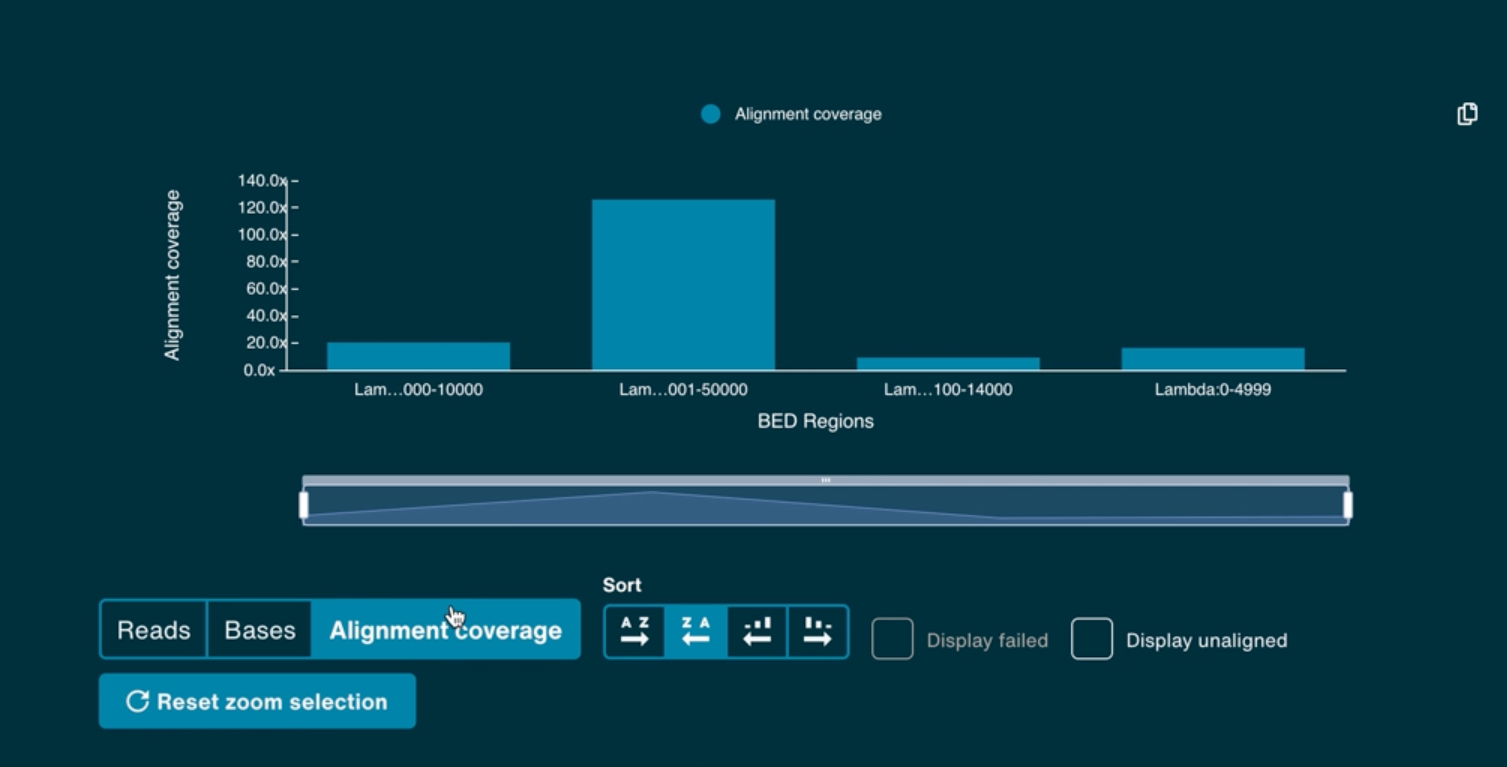
A target alignment hits view is also available in the same graph by clicking Alignment coverage. This is populated by the .BED targets if a .BED file is supplied with the alignment reference.
-
Alignment Q accuracy histogram
The Alignment Q accuracy histogram will populate when alignment and basecalling is set-up to run during sequencing, displaying alignment accuracy.
The graph is functional for both Duplex and Simplex runs.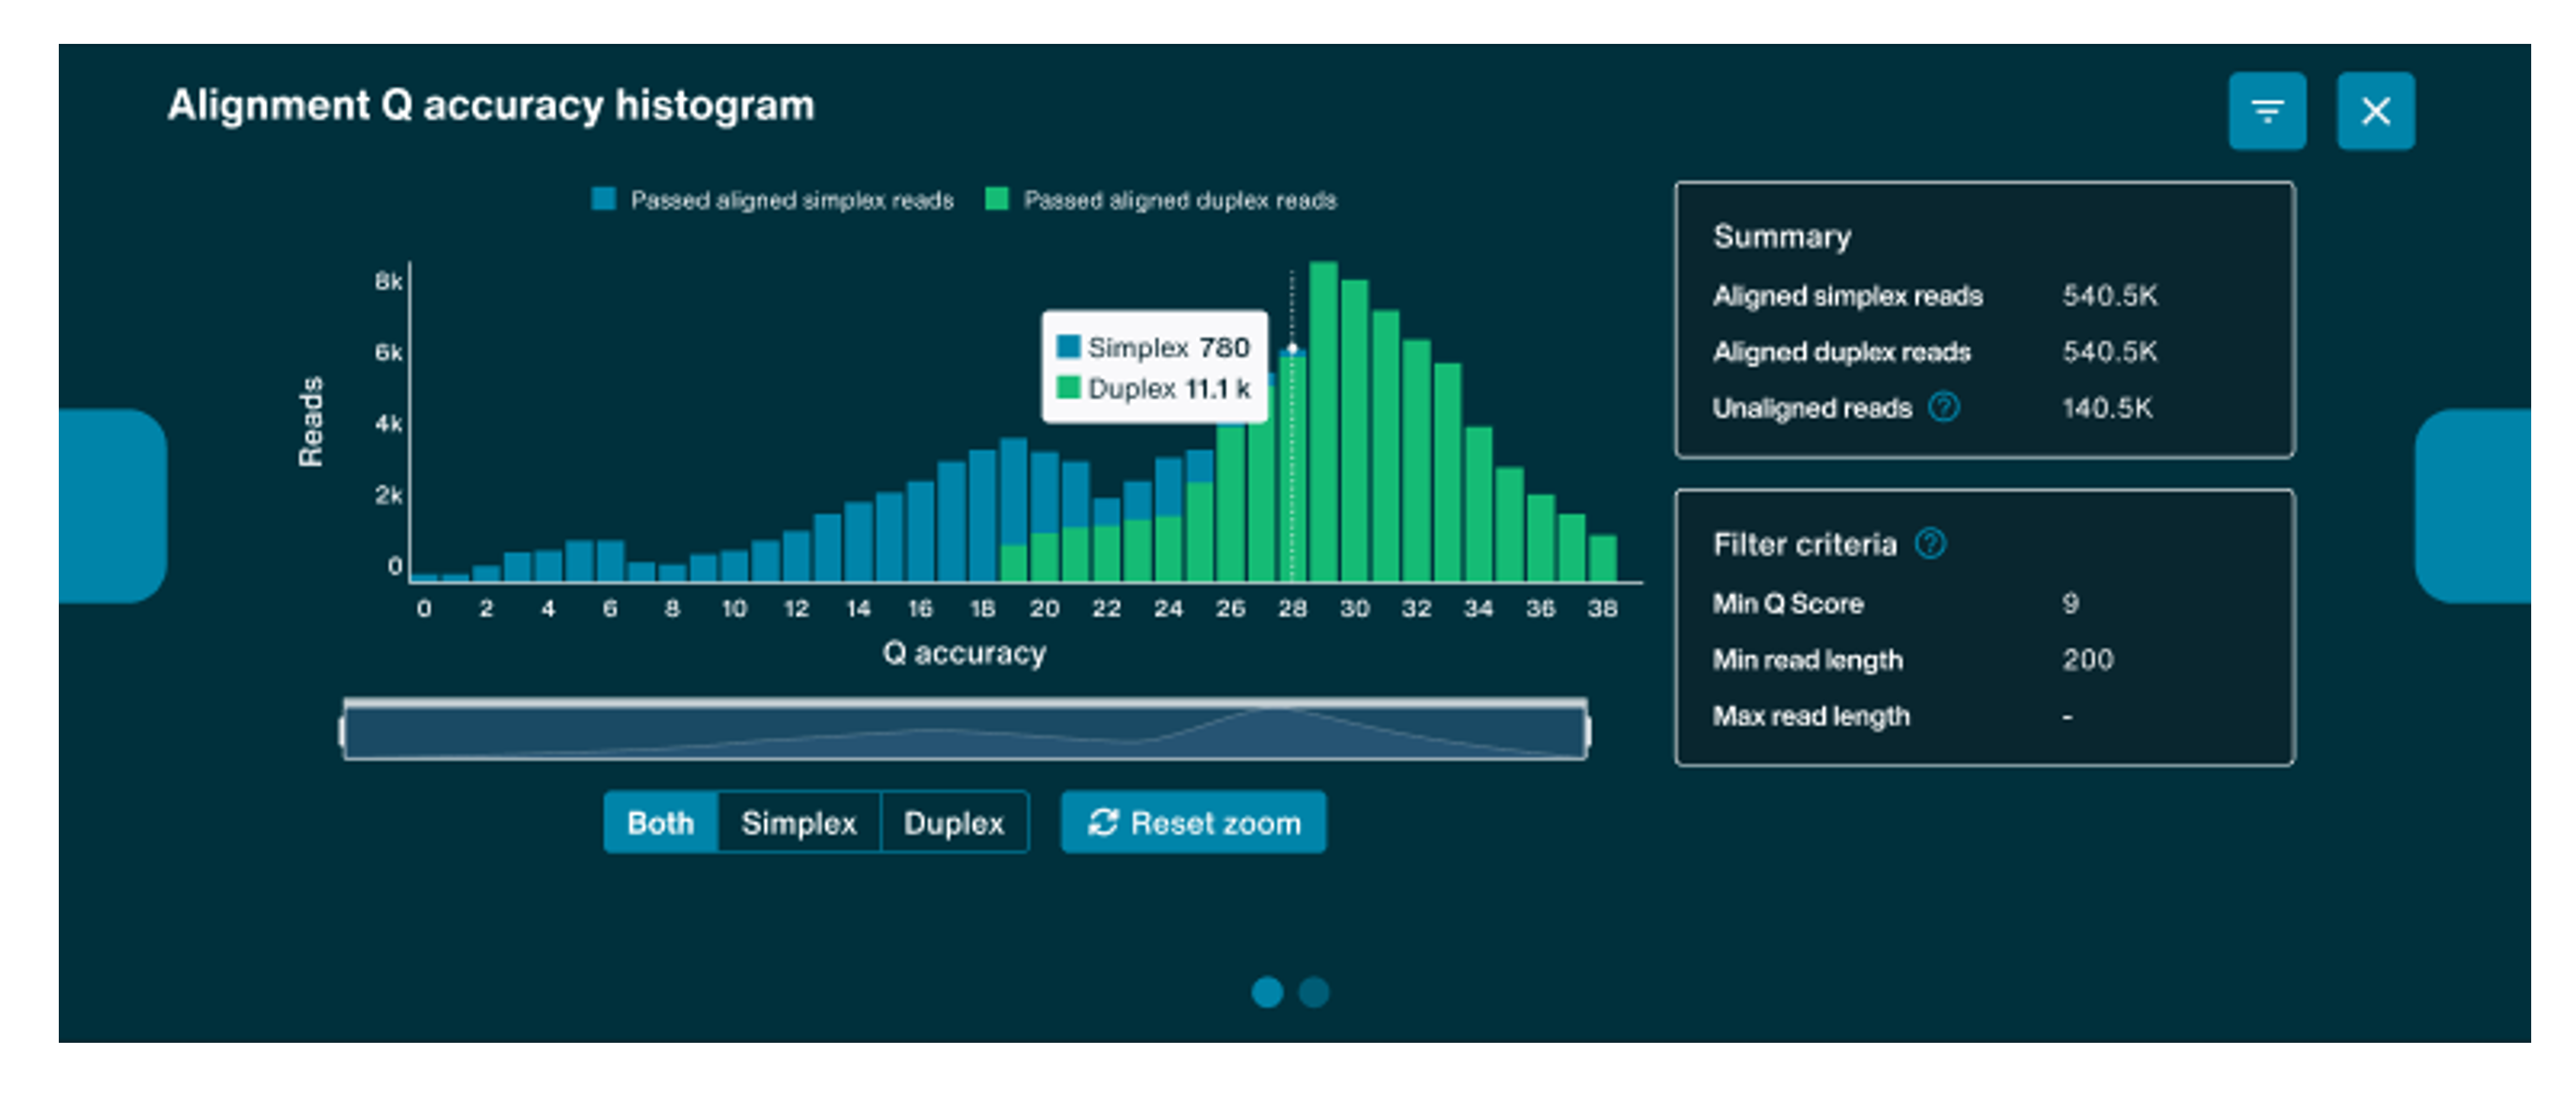
-
Alignment and barcode heatmap
The alignment and barcode heatmap is only available when alignment and demultiplexing is performed with basecalling during sequencing. The heatmap graph shows the alignment hits split per barcode. The colour gradient shows bases and reads which are the more popular barcode and alignment hit combinations.
Use the options below to view reads or bases and the slide bar above to focus on specific regions.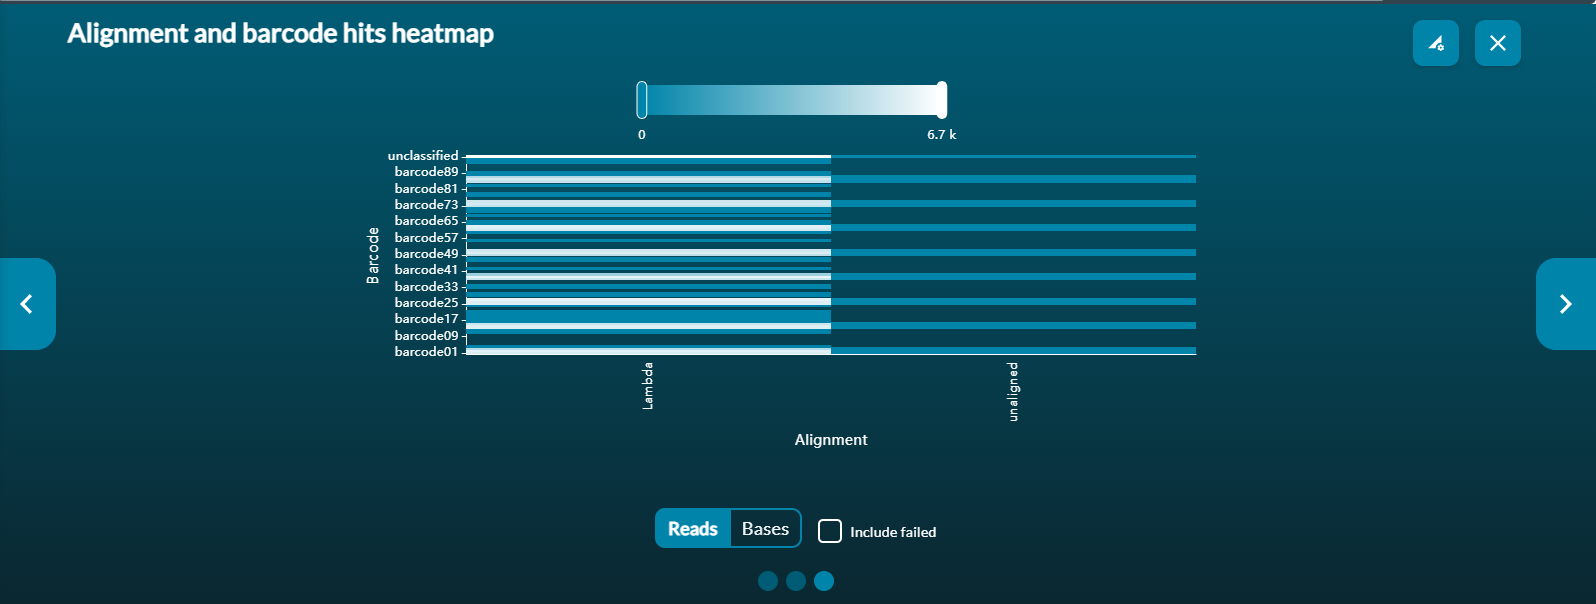
Note: These graphs are only present if barcoding and alignment are both turned on.
-
Traceviewer
The Traceviewer displays the current levels from individual channels. By default, it is set to show 10 channels. This number can be changed through the selection boxes beneath the viewer. Additional parameters that can be altered:
- Time: The length of time plotted on one screen
- Maximum: The highest current level to be shown on the y axis
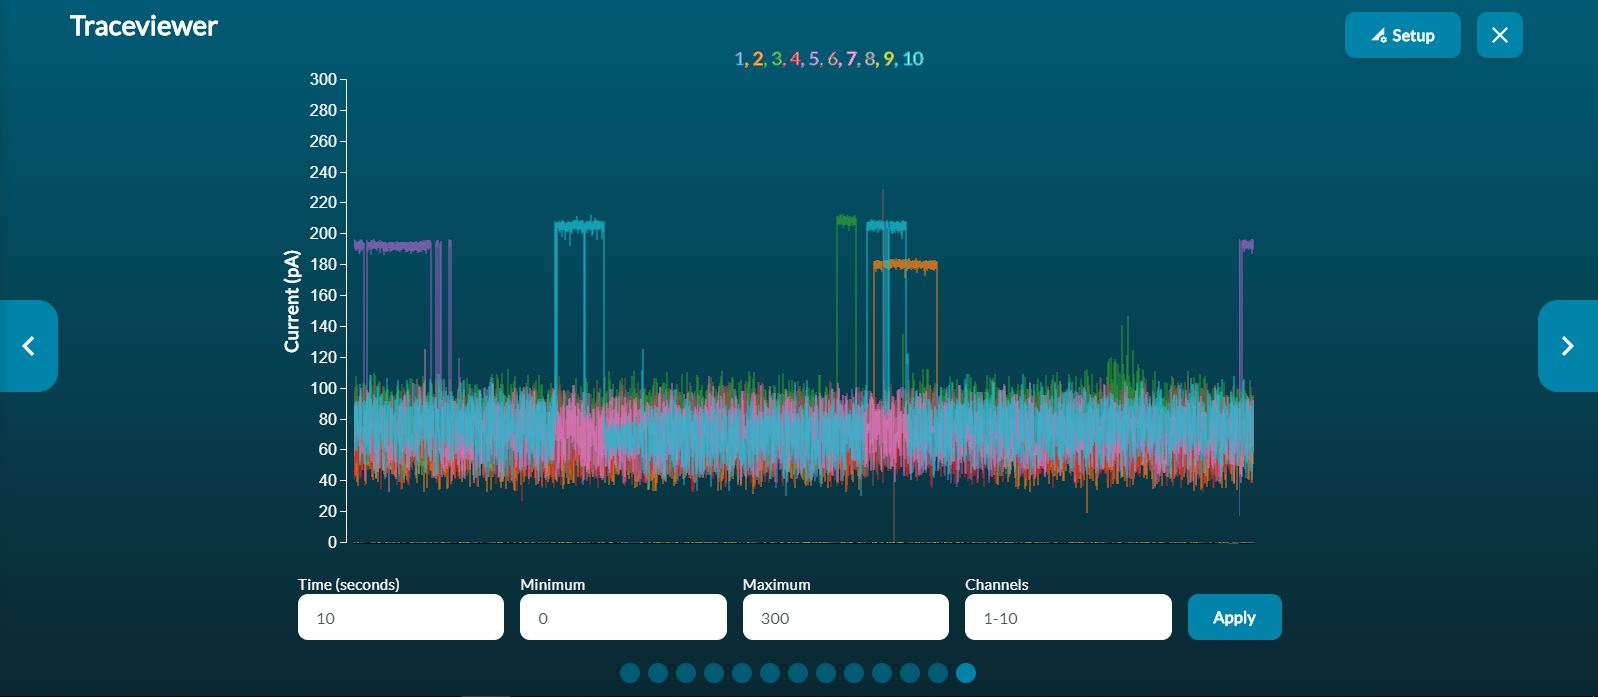
Please note that viewing a high number of channels in the traceviewer may impact the speed at which the GUI is able to function.
-
Pore scan
As the sequencing protocol starts, a pore scan begins before the sequencing. There are four groups of active pores, and the pore scan allows MinKNOW to pick the best-performing pores in each group, maximising the data output in the initial stages of the run. The software also instantly switches to a new channel in the group if a channel is in the “Saturated” state, or after ~5 minutes if a channel is “Recovering”.