-
Overview of nanopore data analysis
For a full overview of nanopore data analysis, which includes options for basecalling and post-basecalling analysis, please refer to the Data Analysis document.
-
How to start sequencing
The sequencing device control, data acquisition and real-time basecalling are carried out by the MinKNOW software. It is assumed you have already installed MinKNOW on your computer. There are multiple options for how to carry out sequencing:
1. Data acquisition and basecalling in real-time using MinKNOW on a computer
Follow the instructions in the MinKNOW protocol beginning from the "Starting a sequencing run" section until the end of the "Completing a MinKNOW run" section.
2. Data acquisition and basecalling in real-time using the GridION device
Follow the instructions in the GridION user manual.
3. Data acquisition and basecalling in real-time using the MinION Mk1C device
Follow the instructions in the MinION Mk1C user manual.
4. Data acquisition and basecalling in real-time using the PromethION device
Follow the instructions in the PromethION user manual or the PromethION 2 Solo user manual.
5. Data acquisition using MinKNOW on a computer and basecalling at a later time using MinKNOW
Follow the instructions in the MinKNOW protocol beginning from the "Starting a sequencing run" section until the end of the "Completing a MinKNOW run" section. When setting your experiment parameters, set the Basecalling tab to OFF. After the sequencing experiment has completed, follow the instructions in the Post-run analysis section of the MinKNOW protocol.
-
Understanding Cas enrichment
The Duty Time feature in the MinKNOW software can be used to judge the quality of your experiment. The duty time plot shows the distribution of channel states over time, grouped by time chunks, or 'buckets'. The basic view shows the five main channel states: Sequencing, Pore, Recovering, Inactive, and Unclassified. Clicking the "More" button shows a more detailed breakdown of channel states.
It is recommended to observe the duty time plot populating over the first 30 min-1 hr of the sequencing run. By this time, the channel state distribution will give an indication whether the DNA library is of a good quality, and whether the flow cell is performing well.
Note: The Duty Time plots will be noticeably different to a conventional SQK-LSK109 run. A much smaller percentage of pores will be observed as Sequencing/Strand.
If Active Channel Selection is enabled during the run, the software instantly switches to a new channel in the group if a channel is in the “Saturated” or “Multiple” state, or after ~5 minutes if a channel is “Recovering”. This feature maximises the number of channels sequencing at the start of the experiment, however this may also result in an artificially high number of "Sequencing" or "Pore" channels in the duty time plot. For this reason, we recommend referring to the Mux Scan Results plot, which shows the true distribution of channel states at the point of the most recent mux scan.
-
Understanding Duty Time plots during a Cas9 targeted sequencing run
As discussed above, the user should expect a lower proportion of pores in Sequencing compared to a standard SQK-LSK109 run, while the total number of available pores should be roughly consistent between a Cas9 targeted sequencing experiment and SQK-LSK109 experiment.
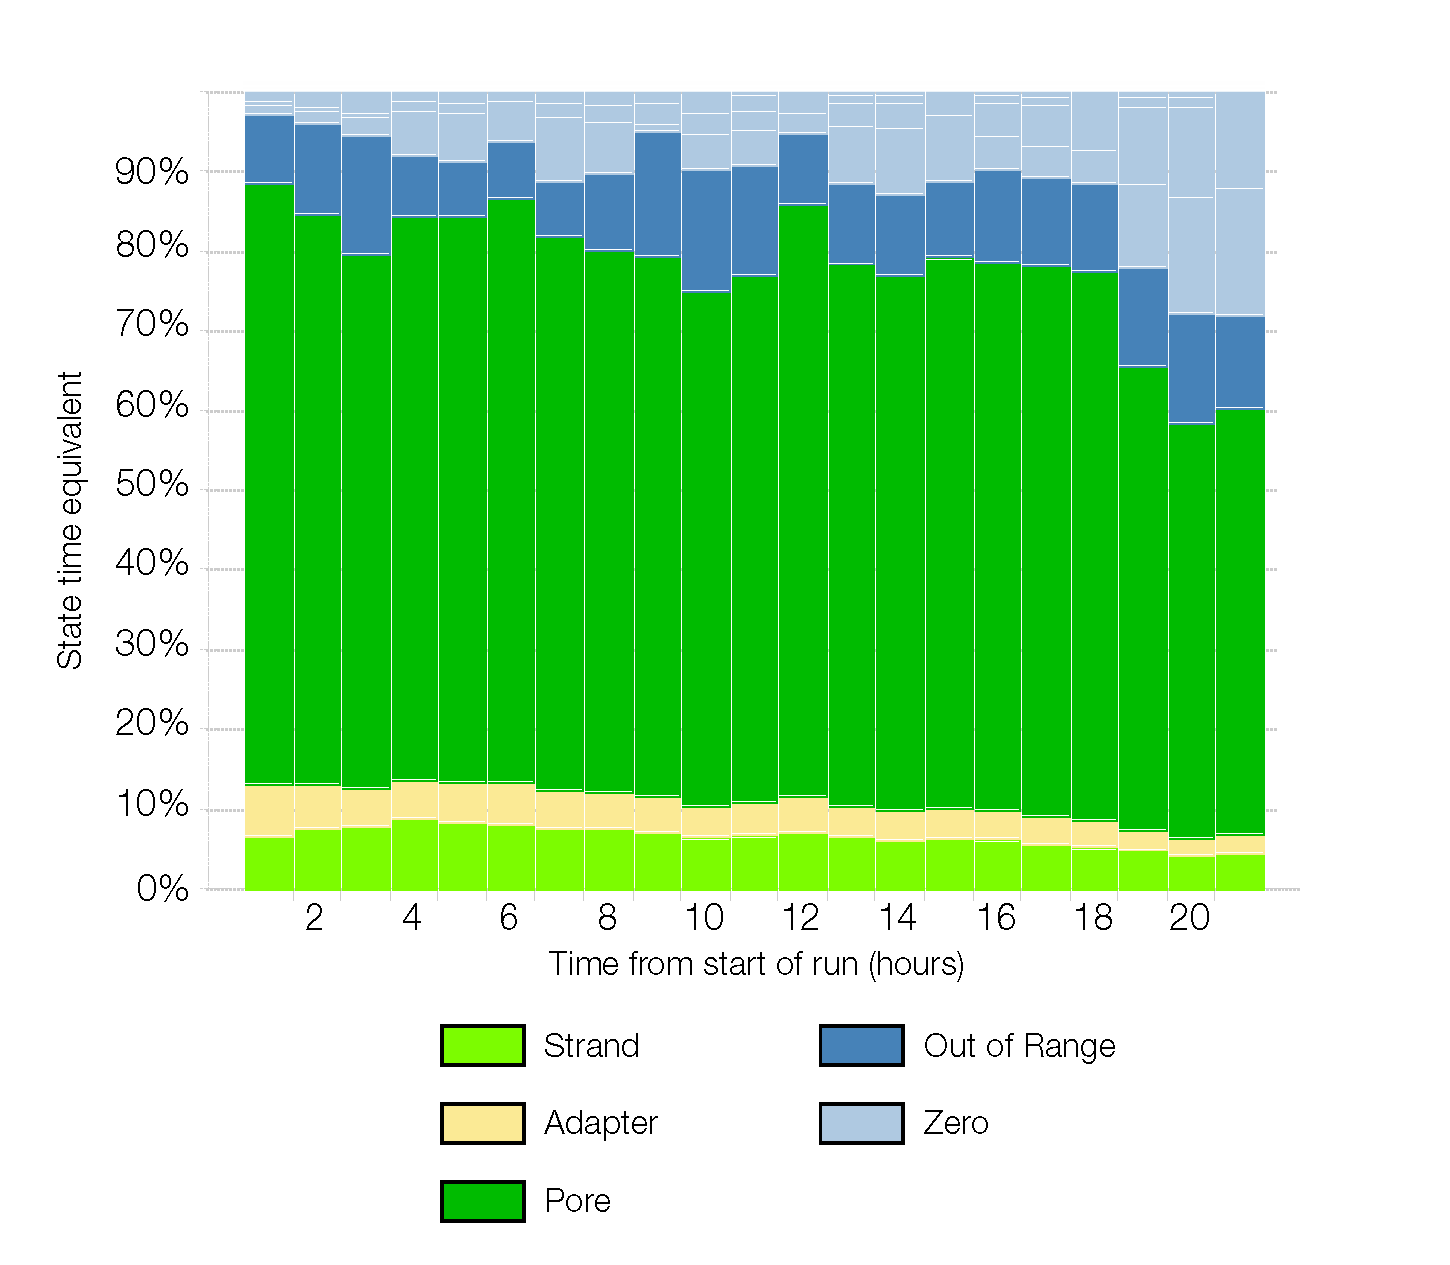
FLO-MIN106 Duty time plot for a Cas9 targeted sequencing experiment using a human gene. From the Duty Time plot, there is an equivalent number of active pores between a SQK-LSK109 run and Cas9 taregeted sequencing run. In a Cas9 experiment, the sequencing pore is roughly 5-15% (light green) of the total number of pores.
