-
Introduction to the Cas9 data analysis tutorial
A tutorial delivering tools for reviewing the performance of a Cas9 targeted sequencing experiment is provided by Oxford Nanopore Technologies. The tutorial guides the assignment of sequences that can be defined as on-target, off-target and background reads and presents both tabular data and graphical plots that can be used to assess the performance of an enrichment study.
This analysis tutorial can be run with two different methods, but both will generate similar statistics, graphs and outputs. The recommended method is using the EPI2ME Labs platform.
-
Input files and set-up
The tutorial requires a FASTQ format sequence file generated by MinKNOW and a BED file for target coordinates as input, along with pointers to download locations for the reference genome to be used. The EPI2ME Labs tutorial has an embedded example dataset to demonstrate the type of files needed and an example of the output.
-
How to interpret the results
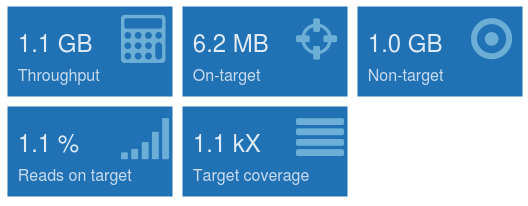
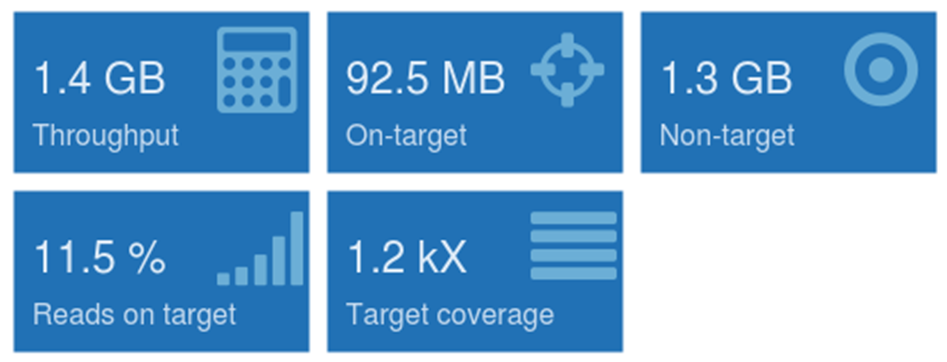
The tutorial aids with the quantification of the non-target depletion and provides information on mapping characteristics that highlight the protocol's performance. The executive summary generated at the end of the EPI2ME Labs tutorial provides the key metrics used to establish whether an experiment has been successful.
Single HTT gene target in human:
10 gene targets (5-15kb) in human:
-
Coverage
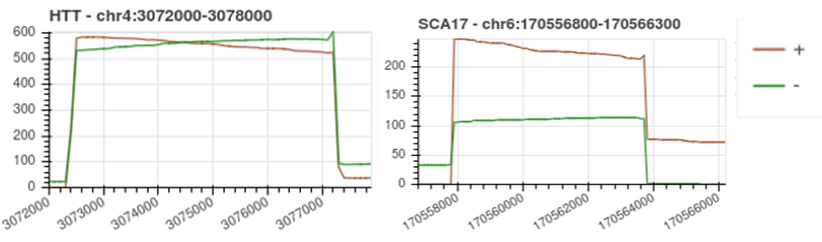
The most important value to focus on is the “Target Coverage”, which will be an average value if multiple targets are being assessed in the same experiment. For a well-designed Cas9 targeted experiment, we would expect >200x coverage for a single target. The coverage of the region of interest is mostly dependent on probe design and input DNA quality. To assess coverage in more detail, the coverage plots show overlapping directional coverage for the region of interest. For multiple targets in the same experiment, when the headline value provides an average coverage, these plots are useful to look at individual coverage of the regions. If the coverage is lower than 200x for a region of interest, the coverage plot can show where a crRNA probe may not be performing well. Firstly, ensure that additional probes have been added to either side of the region of interest for redundancy as explained in the Probe Design section of this document, as this could significantly boost coverage of the region of interest if a probe is not performing well. For probes to be working equally well in both directions (+/-), a similar coverage plot will be observed for both directions as show in the HTT below. In the example of the SCA17 gene below, the + probe has performed better as it has generated a higher coverage than the probe in the – direction. In this example, it would be recommended to review the probes in the – direction to boost overall coverage.
-
Off-target/background
The other figures on the EPI2ME Labs tutorial relate to background reads and off-target regions. Background reads, off-target effects and explanation for the % of reads on-target are described elsewhere in this document, and all of these statistics can be found in the executive summary on the EPI2ME Labs tutorial. If the total “Throughput” of the run is high (similar to that observed with a non-targeted sequencing run), it is likely that the dephosphorylation step has not worked in the preparation, and new reagents are recommended. Please note that the % of reads on-target is dependent on the size of the region of interest compared to the size of the genome. As well as the headline stats, the EPI2ME Labs tutorial provides an insight into possible off-target regions. These regions are described as areas of the genome that are outside of the region of interest but have a higher coverage than the background coverage of the genome. These regions arise from crRNA probes causing Cas9 to cut at other sequences very similar to the sequences being cut around the region of interest. To reduce the number of off-target sites, and in turn boost the coverage of the region of interest by reducing the activity of Cas9 in other regions and focusing more on the region of interest, we recommend reviewing the the crRNA probe design.
-
Further analysis
Output from the EPI2ME Labs tutorial can be assessed in IGV for a more detailed visualisation of the region of interest. The output can also be further processed by other bioinformatic tools to assess SNPs, SV and repeat counting. Refer to Bioinformatics Resource page in the Nanopore Community for more information.


