-
The Cas9 targeted sequencing protocol depletes off-target DNA, therefore enriching for the region of interest.
As the target region is often a small part of the genome of interest, the overall throughput will be lower than a standard Ligation Sequencing Kit (SQK-LSK109) run, but more time is spent sequencing target DNA. Cas9 targeted sequencing experiments will therefore boost the coverage of the region of interest several hundred-fold, and users will see a reduction in coverage of the rest of the genome compared to a whole genome sequencing experiment.
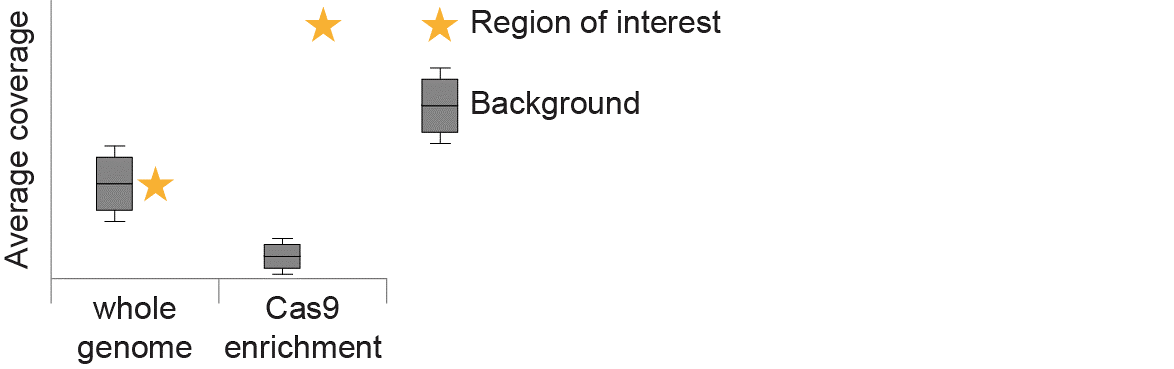
Figure 14. Relative coverage of the whole genome and the Region of Interest with and without Cas9 targeting. -
The main metrics used to show the efficiency of a Cas9 targeted experiment:
- Overall throughput
- % of reads on target
- Coverage of region of interest
- Depletion of the non-target DNA
These key metrics can easy be determined using the Oxford Nanopore Technologies Cas9 enrichment-specific data analysis tutorial, which will also generate coverage plots for the region(s) of interest and provide information about specific off-target cuts (details below).
-
For a well-designed panel looking at 10 target regions ranging from 5-15 kb in the human genome, for example, we would expect the following metrics (MinION R9.4.1 flow cell):
- Overall throughput = >1 Gb
- % of reads on target = 5-10%
- Average coverage of regions of interest = >100x
- Depletion of non-target DNA = ~3000-fold depletion
For larger or smaller genomes and regions of interest, coverage will decrease or increase respectively. Ploidy will also impact coverage, e.g. a haploid cell will have fewer copies per cell than a diploid or triploid cell. Users should calculate the levels of enrichment expected based on their target size, copy number, genome size, etc.
The % of reads that are on-target in a run (and the target coverage) is governed by the set-up of the experiment. Targeting multiple regions in a single sample will give a similar coverage for each target region (compared to sequencing just a single target region) but increase in % of reads on target. This is because we are increasing the proportion of the genome being targeted and therefore increasing the % of input that corresponds to the target. If a user wants to look at a single gene target but in multiple samples, which might be barcoded, then the overall yield of the experiment will be higher but the proportion of reads on-target will be like a single gene, single sample experiment. Coverage per target will also be lower for the multiple sample options.
-
Theoretical relationships between target size and levels of enrichment
(A) No enrichment (B) Single gene target, single sample (C) Ten gene targets, single sample (D) Single gene target, five pooled samples Input per sample 1 µg 5 µg 5 µg 5 µg Number of targets x target size 1x 5 kb 1x 5 kb 10x 5 kb 5x (1x 5 kb) % of target in genome 0.00017% 0.00017% 0.00167% 0.00017% % of input that is target, after enrichment 0.00017% ~0.4% ~4% ~0.4% Total sequencing yield ~10 Gb ~1.1 Gb ~1.1 Gb ~3.7 Gb Target yield (all targets, all samples) 16.7 kb 4.3 Mb 42.5 Mb 14.8 Mb Target coverage/sample 3x 850x 850x 590x Background coverage/sample 3x ~0.35x ~0.35x ~0.25x Table 1. Calculations of enrichment data with variation of several key input parameters. Example cases based on typical sequencing runs of control human reference samples.
-
Sources of background and off-target effects
Non-target DNA observed during sequencing can be split into two categories: off-target and background. Each crRNA in a panel should allow Cas9 to cut genomic DNA at the site that perfectly matches its sequence, but may also cut at sites bearing multiple mismatches, leading to adapter ligation at those sites and a reduced proportion of on-target reads. This “off-target” activity can be mitigated by the careful design of crRNAs to have a minimum number of mismatches while maintaining cut efficiency. Background DNA can come from efficiency in the dephosphorylation step or ligation of sequencing adapters to non-cut DNA.
To analyse enrichment data and assess the level of off-target and background DNA sequenced, please refer to the Evaluation of read-mapping characteristics from a Cas-mediated PCR-free enrichment bioinformatics tutorial.
-
DNA input requirements
For optimal target coverage, Cas9 targeted sequencing experiments require at least ~5 pg of target material in the input. For example, enrichment of a 5 kb human gene would require 5 µg of input DNA.
Input amount Total throughput (Gb) % of reads on target % of bases on target Total Mb on target Mean number of reads per target (coverage) Mean Mb per target 500 ng 0.06 5 4 2 37 0.2 1 µg 0.12 5 4 4 75 0.4 2 µg 0.37 5 4 13 240 1.3 5 µg 1.00 6 5 43 880 4.3 Table 2. Experimental data from an DNA input titration from a human 10 gene-panel using the Ca9 targeted sequencing protocol. The proportion of reads or bases on target remains constant, but target coverage is roughly proportional to input amount, for 500 ng to 5 µg total input.
For an efficient enrichment experiment, high molecular weight DNA is required. The median length of molecules in a genomic DNA sample can greatly impact upon the efficiency of the enrichment in two main ways:
- The shorter the median DNA fragment length, the greater the concentration of DNA ends that must be protected from ligation (assuming constant mass of DNA). Thus, in general, the shorter the DNA, the greater the background
- If pairs of crRNAs designed to excise a ROI are placed more than one median fragment length apart, coverage drop between the cut sites will be significant.
For these reasons, we recommend purifying genomic DNA to the highest possible length and quality and matching the spacing of crRNAs to the expected median fragment length.
